Pitney Bowes 2009 Annual Report Download - page 77
Download and view the complete annual report
Please find page 77 of the 2009 Pitney Bowes annual report below. You can navigate through the pages in the report by either clicking on the pages listed below, or by using the keyword search tool below to find specific information within the annual report.-
 1
1 -
2
-
3
-
4
-
5
-
6
-
7
-
8
-
9
-
10
-
11
-
12
-
13
-
14
-
15
-
16
-
17
-
18
-
19
-
20
-
21
-
22
-
23
-
24
-
25
-
26
-
27
-
28
-
29
-
30
-
31
-
32
-
33
-
34
-
35
-
36
-
37
-
38
-
39
-
40
-
41
-
42
-
43
-
44
-
45
-
46
-
47
-
48
-
49
-
50
-
51
-
52
-
53
-
54
-
55
-
56
-
57
-
58
-
59
-
60
-
61
-
62
-
63
-
64
-
65
-
66
-
 67
67 -
 68
68 -
 69
69 -
 70
70 -
 71
71 -
 72
72 -
 73
73 -
 74
74 -
 75
75 -
 76
76 -
 77
77 -
 78
78 -
 79
79 -
 80
80 -
 81
81 -
 82
82 -
 83
83 -
 84
84 -
 85
85 -
 86
86 -
 87
87 -
88
-
89
-
90
-
91
-
92
-
93
-
94
-
95
-
96
-
97
-
98
-
99
-
100
-
101
-
102
-
103
-
104
-
105
-
106
-
107
-
108
-
109
-
110
-
111
-
112
-
113
-
114
-
115
-
116
-
117
-
118
-
119
-
120
-
121
-
122
-
123
-
124
 |
 |

PITNEY BOWES INC.
NOTES TO CONSOLIDATED FINANCIAL STATEMENTS
(Tabular dollars in thousands, except per share data)
59
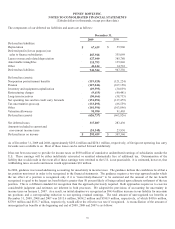
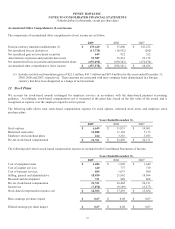
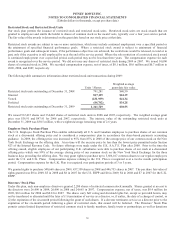
The components of our deferred tax liabilities and assets are as follows:
December 31,
2009 2008
Deferred tax liabilities:
Depreciation $ 67,639 $ 55,960
Deferred profit (for tax purposes) on
sales to finance subsidiaries 287,928 355,069
Lease revenue and related depreciation 427,040 385,780
Amortizable intangibles 115,793 135,846
Other 46,144 14,701
Deferred tax liabilities 944,544 947,356
Deferred tax (assets):
Nonpension postretirement benefits (119,420) (121,224)
Pension (127,046) (167,158)
Inventory and equipment capitalization (29,595) (30,839)
Restructuring charges (9,619) (49,441)
Long-term incentives (50,666) (58,735)
Net operating loss and tax credit carry forwards (151,094) (137,479)
Tax uncertainties gross-up (133,293) (86,559)
Other (101,994) (103,896)
Valuation allowance 95,990 91,405
Deferred tax (assets) (626,737) (663,926)
Net deferred taxes 317,807 283,430
Amounts included in current and
non-current income taxes (24,348) 23,930
Deferred taxes on income $ 293,459 $ 307,360
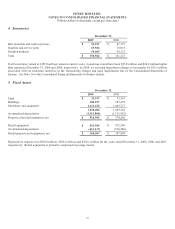
As of December 31, 2009 and 2008, approximately $285.4 million and $250.1 million, respectively, of foreign net operating loss carry
forwards were available to us. Most of these losses can be carried forward indefinitely.
It has not been necessary to provide for income taxes on $830 million of cumulative undistributed earnings of subsidiaries outside the
U.S. These earnings will be either indefinitely reinvested or remitted substantially free of additional tax. Determination of the
liability that would result in the event all of these earnings were remitted to the U.S. is not practicable. It is estimated, however, that
withholding taxes on such remittances would approximate $16 million.
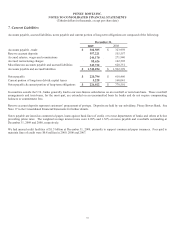
In 2006, guidance was issued addressing accounting for uncertainty in income taxes. The guidance defines the confidence level that a
tax position must meet in order to be recognized in the financial statements. The guidance requires a two-step approach under which
the tax effect of a position is recognized only if it is “more-likely-than-not” to be sustained and the amount of the tax benefit
recognized is equal to the largest tax benefit that is greater than 50 percent likely of being realized upon ultimate settlement of the tax
position. This is a different standard for recognition than the approach previously required. Both approaches require us to exercise
considerable judgment and estimates are inherent in both processes. We adopted the provisions of accounting for uncertainty in
income taxes on January 1, 2007. As a result, on initial adoption we recognized an $84.4 million increase in our liability for uncertain
tax positions and a corresponding reduction to our opening retained earnings. The total amount of unrecognized tax benefits at
December 31, 2009, 2008 and 2007 was $515.6 million, $434.2 million and $398.9 million, respectively, of which $410.6 million,
$370.9 million and $335.7 million, respectively, would affect the effective tax rate if recognized. A reconciliation of the amount of
unrecognized tax benefits at the beginning and end of 2009, 2008 and 2007 is as follows: