Pitney Bowes 2009 Annual Report Download - page 36
Download and view the complete annual report
Please find page 36 of the 2009 Pitney Bowes annual report below. You can navigate through the pages in the report by either clicking on the pages listed below, or by using the keyword search tool below to find specific information within the annual report.-
 1
1 -
2
-
3
-
4
-
5
-
6
-
7
-
8
-
9
-
10
-
11
-
12
-
13
-
14
-
15
-
16
-
17
-
18
-
19
-
20
-
21
-
22
-
23
-
24
-
25
-
 26
26 -
 27
27 -
 28
28 -
 29
29 -
 30
30 -
 31
31 -
 32
32 -
 33
33 -
 34
34 -
 35
35 -
 36
36 -
 37
37 -
 38
38 -
 39
39 -
 40
40 -
 41
41 -
 42
42 -
 43
43 -
 44
44 -
 45
45 -
 46
46 -
47
-
48
-
49
-
50
-
51
-
52
-
53
-
54
-
55
-
56
-
57
-
58
-
59
-
60
-
61
-
62
-
63
-
64
-
65
-
66
-
67
-
68
-
69
-
70
-
71
-
72
-
73
-
74
-
75
-
76
-
77
-
78
-
79
-
80
-
81
-
82
-
83
-
84
-
85
-
86
-
87
-
88
-
89
-
90
-
91
-
92
-
93
-
94
-
95
-
96
-
97
-
98
-
99
-
100
-
101
-
102
-
103
-
104
-
105
-
106
-
107
-
108
-
109
-
110
-
111
-
112
-
113
-
114
-
115
-
116
-
117
-
118
-
119
-
120
-
121
-
122
-
123
-
124
 |
 |

18
million in 2008 from $7 million in 2007 driven by higher volumes in the Company’s mover-source program and its phased exit from
the motor vehicle registration services program.
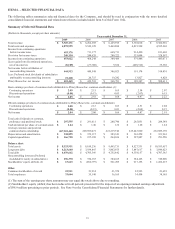
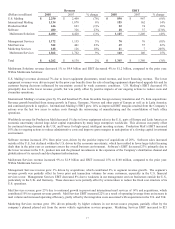
Revenue by source
(Dollars in millions) 2008 2007 % change
Equipment sales $ 1,252 $ 1,336 (6)%
Supplies 392 393 - %
Software 424 346 23 %
Rentals 728 739 (1)%
Financing 773 790 (2)%
Support services 769 761 1 %
Business services 1,924 1,765 9 %
Total revenue $ 6,262 $ 6,130 2 %
Equipment sales revenue decreased 6% compared to the prior year. Lower sales of equipment in U.S. Mailing were primarily due to
the postal rate case in 2007, which resulted in incremental sales of mailing equipment shape-based upgrade kits during that period and
pulled sales forward from 2008, weakening global economic conditions, and product shift toward smaller, fully featured postage
machines. International sales revenue, excluding the positive impact from foreign currency of 2% and acquisitions of 2%, increased
2% principally due to a postal rate change in the first quarter of 2008 in France, combined with higher equipment placements
throughout Europe. Foreign currency translation contributed an overall favorable impact of 1% to equipment sales revenue.
Supplies revenue in 2008 was flat compared to the prior year. The decline of supplies revenue in the U.S was due to lower volumes,
offset by an increase in supplies revenue in Europe as our customers continue to migrate to digital technology. Foreign currency
translation contributed 1% to supplies revenue.
Software revenue increased by 23% from the prior year primarily driven by acquisitions which contributed 19% to revenue growth
and strong international demand for our location intelligence and customer communication software solutions. Foreign currency
translation had a negative impact of 2%.
Rentals revenue decreased 1% compared to the prior year. Favorable foreign currency translation of 1% and higher demand in France
were offset by lower revenue in the U.S., as our customers continue to downsize to smaller, fully featured machines.
Financing revenue decreased 2% compared to the prior year. Lower equipment sales have resulted in a corresponding decline in the
U.S. lease portfolio.
Support services revenue increased 1% from the prior year primarily due to the favorable impact of foreign currency translation of
1%. Renewals and pricing increases offset the impact of customers down-sizing their equipment.
Business services revenue increased 9% from the prior year, of which acquisitions contributed 7%. The additional growth was driven
by higher revenues in Mail Services and Marketing Services, partly offset by lower transaction volumes in Management Services.
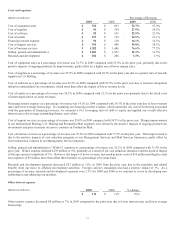
Costs and expenses
(Dollars in millions) Percentage of Revenue
2008 2007 2008 2007
Cost of equipment sales $663 $697 53.0% 52.2%
Cost of supplies $104 $107 26.5% 27.1%
Cost of software $101 $82 23.9% 23.7%
Cost of rentals $154 $171 21.1% 23.2%
Financing interest expense $110 $127 14.3% 16.0%
Cost of support services $448 $433 58.3% 56.9%
Cost of business services $1,486 $1,357 77.2% 76.9%
Selling, general and administrative $1,971 $1,930 31.5% 31.5%
Research and development $206 $186 3.3% 3.0%