PG&E 2014 Annual Report Download - page 90
Download and view the complete annual report
Please find page 90 of the 2014 PG&E annual report below. You can navigate through the pages in the report by either clicking on the pages listed below, or by using the keyword search tool below to find specific information within the annual report.-
 1
1 -
2
-
3
-
4
-
5
-
6
-
7
-
8
-
9
-
10
-
11
-
12
-
13
-
14
-
15
-
16
-
17
-
18
-
19
-
20
-
21
-
22
-
23
-
24
-
25
-
26
-
27
-
28
-
29
-
30
-
31
-
32
-
33
-
34
-
35
-
36
-
37
-
38
-
39
-
40
-
41
-
42
-
43
-
44
-
45
-
46
-
47
-
48
-
49
-
50
-
51
-
52
-
53
-
54
-
55
-
56
-
57
-
58
-
59
-
60
-
61
-
62
-
63
-
64
-
65
-
66
-
67
-
68
-
69
-
70
-
71
-
72
-
73
-
74
-
75
-
76
-
77
-
78
-
79
-
 80
80 -
 81
81 -
 82
82 -
 83
83 -
 84
84 -
 85
85 -
 86
86 -
 87
87 -
 88
88 -
 89
89 -
 90
90 -
 91
91 -
 92
92 -
 93
93 -
 94
94 -
 95
95 -
 96
96 -
 97
97 -
 98
98 -
 99
99 -
 100
100 -
101
-
102
-
103
-
104
-
105
-
106
-
107
-
108
-
109
-
110
-
111
-
112
-
113
-
114
-
115
-
116
-
117
-
118
-
119
-
120
-
121
-
122
-
123
-
124
-
125
-
126
-
127
-
128
-
129
-
130
-
131
-
132
-
133
-
134
-
135
-
136
-
137
-
138
-
139
-
140
-
141
-
142
-
143
-
144
-
145
-
146
-
147
-
148
-
149
-
150
-
151
-
152
-
153
-
154
-
155
-
156
-
157
-
158
-
159
-
160
-
161
-
162
-
163
-
164
 |
 |

82
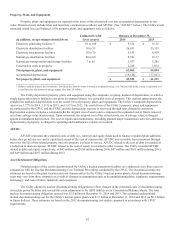
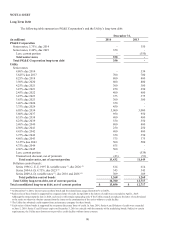
Property, Plant, and Equipment
Property, plant, and equipment are reported at the lower of their historical cost less accumulated depreciation or fair
value. Historical costs include labor and materials, construction overhead, and AFUDC. (See “AFUDC” below.) The Utility’s total
estimated useful lives and balances of its property, plant, and equipment were as follows:
Estimated Useful Balance at December 31,
(in millions, except estimated useful lives) Lives (years) 2014 2013
Electricity generating facilities (1) 10 to 100 $ 9,374 $ 9,116
Electricity distribution facilities 10 to 55 26,633 25,333
Electricity transmission facilities 10 to 70 9,155 8,429
Natural gas distribution facilities 20 to 60 9,741 9,117
Natural gas transportation and storage facilities 7 to 65 5,937 5,265
Construction work in progress 2,220 1,834
Total property, plant, and equipment 63,060 59,094
Accumulated depreciation (19,120) (17,843)
Net property, plant, and equipment $43,940 $41,251
(1) Balance includes nuclear fuel inventories. Stored nuclear fuel inventory is stated at weighted-average cost. Nuclear fuel in the reactor is expensed as it
is used based on the amount of energy output. (See Note 14 below.)
The Utility depreciates property, plant, and equipment using the composite, or group, method of depreciation, in which a
single depreciation rate is applied to the gross investment balance in a particular class of property. This method approximates the
straight line method of depreciation over the useful lives of property, plant, and equipment. The Utility’s composite depreciation
rates were 3.77% in 2014, 3.51% in 2013, and 3.63% in 2012. The useful lives of the Utility’s property, plant, and equipment
are authorized by the CPUC and the FERC, and the depreciation expense is recovered through rates charged to customers.
Depreciation expense includes a component for the original cost of assets and a component for estimated cost of future removal,
net of any salvage value at retirement. Upon retirement, the original cost of the retired assets, net of salvage value, is charged
against accumulated depreciation. The cost of repairs and maintenance, including planned major maintenance activities and minor
replacements of property, is charged to operating and maintenance expense as incurred.
AFUDC
AFUDC represents the estimated costs of debt (i.e., interest) and equity funds used to finance regulated plant additions
before they go into service and is capitalized as part of the cost of construction. AFUDC is recoverable from customers through
rates over the life of the related property once the property is placed in service. AFUDC related to the cost of debt is recorded as
a reduction to interest expense. AFUDC related to the cost of equity is recorded in other income. The Utility recorded AFUDC
related to debt and equity, respectively, of $45 million and $100 million during 2014, $47 million and $101 million during 2013,
and $49 million and $107 million during 2012.
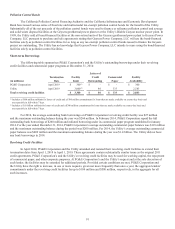
Asset Retirement Obligations
Detailed studies of the cost to decommission the Utility’s nuclear generation facilities are conducted every three years in
conjunction with the Nuclear Decommissioning Cost Triennial Proceeding conducted by the CPUC. The decommissioning cost
estimates are based on the plant location and cost characteristics for the Utility’s nuclear power plants. Actual decommissioning
costs may vary from these estimates as a result of changes in assumptions such as decommissioning dates; regulatory requirements;
technology; and costs of labor, materials, and equipment.
The Utility adjusts its nuclear decommissioning obligation to reflect changes in the estimated costs of decommissioning
its nuclear power facilities and records this as an adjustment to the ARO liability on its Consolidated Balance Sheets. The total
nuclear decommissioning obligation accrued was $2.5 billion at December 31, 2014 and 2013. The estimated undiscounted
nuclear decommissioning cost for the Utility’s nuclear power plants was $3.5 billion at December 31, 2014 and 2013 (or $6.1 billion
in future dollars). These estimates are based on the 2012 decommissioning cost studies, prepared in accordance with CPUC
requirements.