PG&E 2014 Annual Report Download - page 119
Download and view the complete annual report
Please find page 119 of the 2014 PG&E annual report below. You can navigate through the pages in the report by either clicking on the pages listed below, or by using the keyword search tool below to find specific information within the annual report.-
 1
1 -
2
-
3
-
4
-
5
-
6
-
7
-
8
-
9
-
10
-
11
-
12
-
13
-
14
-
15
-
16
-
17
-
18
-
19
-
20
-
21
-
22
-
23
-
24
-
25
-
26
-
27
-
28
-
29
-
30
-
31
-
32
-
33
-
34
-
35
-
36
-
37
-
38
-
39
-
40
-
41
-
42
-
43
-
44
-
45
-
46
-
47
-
48
-
49
-
50
-
51
-
52
-
53
-
54
-
55
-
56
-
57
-
58
-
59
-
60
-
61
-
62
-
63
-
64
-
65
-
66
-
67
-
68
-
69
-
70
-
71
-
72
-
73
-
74
-
75
-
76
-
77
-
78
-
79
-
80
-
81
-
82
-
83
-
84
-
85
-
86
-
87
-
88
-
89
-
90
-
91
-
92
-
93
-
94
-
95
-
96
-
97
-
98
-
99
-
100
-
101
-
102
-
103
-
104
-
105
-
106
-
107
-
108
-
 109
109 -
 110
110 -
 111
111 -
 112
112 -
 113
113 -
 114
114 -
 115
115 -
 116
116 -
 117
117 -
 118
118 -
 119
119 -
 120
120 -
 121
121 -
 122
122 -
 123
123 -
 124
124 -
 125
125 -
 126
126 -
 127
127 -
 128
128 -
 129
129 -
130
-
131
-
132
-
133
-
134
-
135
-
136
-
137
-
138
-
139
-
140
-
141
-
142
-
143
-
144
-
145
-
146
-
147
-
148
-
149
-
150
-
151
-
152
-
153
-
154
-
155
-
156
-
157
-
158
-
159
-
160
-
161
-
162
-
163
-
164
 |
 |

111
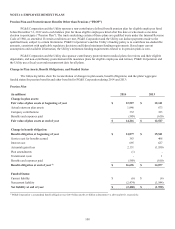
The estimated amounts that will be amortized into net periodic benefit costs for PG&E Corporation in 2015 are as
follows:
(in millions) Pension Plan PBOP Plans
Unrecognized prior service cost $ 15 $ 19
Unrecognized net loss 11 4
Total $ 26 $ 23
There were no material differences between the estimated amounts that will be amortized into net periodic benefit costs
for PG&E Corporation and the Utility.
Valuation Assumptions
In 2014, PG&E Corporation and the Utility adopted the Society of Actuaries 2014 Mortality Tables Report (RP-2014)
and Mortality Improvement Scale (MP-2014 with modifications), which updated the mortality assumptions used for measuring
retirement plan obligations. This new mortality table and improvement scale extends the assumed life expectancy of plan
participants, resulting in an increase in PG&E Corporation’s and the Utility’s accrued benefit cost as of December 31, 2014. Total
pension and postretirement benefit obligation increased $82 million and $18 million in 2014, respectively.
The following actuarial assumptions were used in determining the projected benefit obligations and the net periodic
benefit costs. The following weighted average year-end assumptions were used in determining the plans’ projected benefit
obligations and net benefit cost.
Pension Plan PBOP Plans
December 31, December 31,
2014 2013 2012 2014 2013 2012
Discount rate 4.00 % 4.89 % 3.98 % 3.89 - 4.09 % 4.70 - 5.00 % 3.75 - 4.08 %
Rate of future compensation
increases 4.00 % 4.00 % 4.00 % - - -
Expected return on plan
assets 6.20 % 6.50 % 5.40 % 3.30 - 6.70 % 3.50 - 6.70 % 2.90 - 6.10 %
The assumed health care cost trend rate as of December 31, 2014 was 7.5%, decreasing gradually to an ultimate trend rate
in 2024 and beyond of approximately 3.5%. A one-percentage-point change in assumed health care cost trend rate would have the
following effects:
One-Percentage-Point One-Percentage-Point
(in millions) Increase Decrease
Effect on postretirement benet obligation $ 107 $ (108)
Effect on service and interest cost 8 (8)
Expected rates of return on plan assets were developed by determining projected stock and bond returns and then applying
these returns to the target asset allocations of the employee benefit plan trusts, resulting in a weighted average rate of return on plan
assets. Returns on fixed-income debt investments were projected based on real maturity and credit spreads added to a long-term
inflation rate. Returns on equity investments were estimated based on estimates of dividend yield and real earnings growth added
to a long-term inflation rate. For the pension plan, the assumed return of 6.2% compares to a ten-year actual return of 9.3%.
The rate used to discount pension benefits and other benefits was based on a yield curve developed from market data of over
approximately 715 Aa-grade non-callable bonds at December 31, 2014. This yield curve has discount rates that vary based on the
duration of the obligations. The estimated future cash flows for the pension benefits and other benefit obligations were matched to
the corresponding rates on the yield curve to derive a weighted average discount rate.