PG&E 2014 Annual Report Download - page 80
Download and view the complete annual report
Please find page 80 of the 2014 PG&E annual report below. You can navigate through the pages in the report by either clicking on the pages listed below, or by using the keyword search tool below to find specific information within the annual report.-
 1
1 -
2
-
3
-
4
-
5
-
6
-
7
-
8
-
9
-
10
-
11
-
12
-
13
-
14
-
15
-
16
-
17
-
18
-
19
-
20
-
21
-
22
-
23
-
24
-
25
-
26
-
27
-
28
-
29
-
30
-
31
-
32
-
33
-
34
-
35
-
36
-
37
-
38
-
39
-
40
-
41
-
42
-
43
-
44
-
45
-
46
-
47
-
48
-
49
-
50
-
51
-
52
-
53
-
54
-
55
-
56
-
57
-
58
-
59
-
60
-
61
-
62
-
63
-
64
-
65
-
66
-
67
-
68
-
69
-
 70
70 -
 71
71 -
 72
72 -
 73
73 -
 74
74 -
 75
75 -
 76
76 -
 77
77 -
 78
78 -
 79
79 -
 80
80 -
 81
81 -
 82
82 -
 83
83 -
 84
84 -
 85
85 -
 86
86 -
 87
87 -
 88
88 -
 89
89 -
 90
90 -
91
-
92
-
93
-
94
-
95
-
96
-
97
-
98
-
99
-
100
-
101
-
102
-
103
-
104
-
105
-
106
-
107
-
108
-
109
-
110
-
111
-
112
-
113
-
114
-
115
-
116
-
117
-
118
-
119
-
120
-
121
-
122
-
123
-
124
-
125
-
126
-
127
-
128
-
129
-
130
-
131
-
132
-
133
-
134
-
135
-
136
-
137
-
138
-
139
-
140
-
141
-
142
-
143
-
144
-
145
-
146
-
147
-
148
-
149
-
150
-
151
-
152
-
153
-
154
-
155
-
156
-
157
-
158
-
159
-
160
-
161
-
162
-
163
-
164
 |
 |

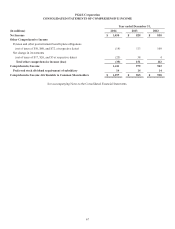
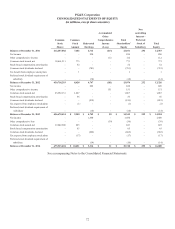
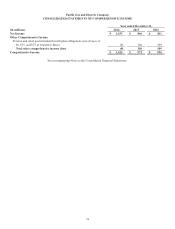
72
PG&E Corporation
CONSOLIDATED STATEMENTS OF EQUITY
(in millions, except share amounts)
Non
Accumulated controlling
Other Interest -
Common Common Comprehensive Total Preferred
Stock Stock Reinvested Income Shareholders’ Stock of Total
Shares Amount Earnings (Loss) Equity Subsidiary Equity
Balance at December 31, 2011 412,257,082 7,602 4,712 (213) 12,101 252 12,353
Net income - - 830 - 830 - 830
Other comprehensive income - - - 112 112 -112
Common stock issued, net 18,461,211 773 - - 773 - 773
Stock-based compensation amortization - 52 - - 52 - 52
Common stock dividends declared - - (781) -(781) -(781)
Tax benet from employee stock plans - 1 - - 1 - 1
Preferred stock dividend requirement of
subsidiary - - (14) -(14) -(14)
Balance at December 31, 2012 430,718,293 8,428 4,747 (101) 13,074 252 13,326
Net income - - 828 - 828 - 828
Other comprehensive income - - - 151 151 - 151
Common stock issued, net 25,952,131 1,067 - - 1,067 - 1,067
Stock-based compensation amortization - 56 - - 56 - 56
Common stock dividends declared - - (819) -(819) -(819)
Tax expense from employee stock plans -(1) - - (1) -(1)
Preferred stock dividend requirement of
subsidiary - - (14) -(14) -(14)
Balance at December 31, 2013 456,670,424 $ 9,550 $ 4,742 $ 50 $ 14,342 $ 252 $ 14,594
Net income - - 1,450 - 1,450 - 1,450
Other comprehensive loss - - - (39) (39) -(39)
Common stock issued, net 19,242,980 823 - - 823 - 823
Stock-based compensation amortization - 65 - - 65 - 65
Common stock dividends declared - - (862) -(862) -(862)
Tax expense from employee stock plans -(17) - - (17) -(17)
Preferred stock dividend requirement of
subsidiary - - (14) -(14) -(14)
Balance at December 31, 2014 475,913,404 $ 10,421 $ 5,316 $ 11 $ 15,748 $ 252 $ 16,000
See accompanying Notes to the Consolidated Financial Statements.