PG&E 2014 Annual Report Download - page 136
Download and view the complete annual report
Please find page 136 of the 2014 PG&E annual report below. You can navigate through the pages in the report by either clicking on the pages listed below, or by using the keyword search tool below to find specific information within the annual report.-
 1
1 -
2
-
3
-
4
-
5
-
6
-
7
-
8
-
9
-
10
-
11
-
12
-
13
-
14
-
15
-
16
-
17
-
18
-
19
-
20
-
21
-
22
-
23
-
24
-
25
-
26
-
27
-
28
-
29
-
30
-
31
-
32
-
33
-
34
-
35
-
36
-
37
-
38
-
39
-
40
-
41
-
42
-
43
-
44
-
45
-
46
-
47
-
48
-
49
-
50
-
51
-
52
-
53
-
54
-
55
-
56
-
57
-
58
-
59
-
60
-
61
-
62
-
63
-
64
-
65
-
66
-
67
-
68
-
69
-
70
-
71
-
72
-
73
-
74
-
75
-
76
-
77
-
78
-
79
-
80
-
81
-
82
-
83
-
84
-
85
-
86
-
87
-
88
-
89
-
90
-
91
-
92
-
93
-
94
-
95
-
96
-
97
-
98
-
99
-
100
-
101
-
102
-
103
-
104
-
105
-
106
-
107
-
108
-
109
-
110
-
111
-
112
-
113
-
114
-
115
-
116
-
117
-
118
-
119
-
120
-
121
-
122
-
123
-
124
-
125
-
 126
126 -
 127
127 -
 128
128 -
 129
129 -
 130
130 -
 131
131 -
 132
132 -
 133
133 -
 134
134 -
 135
135 -
 136
136 -
 137
137 -
 138
138 -
 139
139 -
 140
140 -
 141
141 -
 142
142 -
 143
143 -
 144
144 -
 145
145 -
 146
146 -
147
-
148
-
149
-
150
-
151
-
152
-
153
-
154
-
155
-
156
-
157
-
158
-
159
-
160
-
161
-
162
-
163
-
164
 |
 |

128
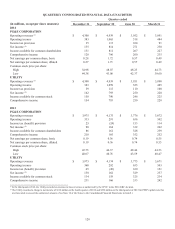
QUARTERLY CONSOLIDATED FINANCIAL DATA (UNAUDITED)
Quarter ended
(in millions, except per share amounts) December 31 September 30 June 30 March 31
2014
PG&E CORPORATION
Operating revenues (1) $ 4,308 $ 4,939 $ 3,952 $ 3,891
Operating income 383 1,065 518 484
Income tax provision 35 115 104 91
Net income (2) 135 814 271 230
Income available for common shareholders 131 811 267 227
Comprehensive income 120 796 260 235
Net earnings per common share, basic 0.28 1.72 0.57 0.49
Net earnings per common share, diluted 0.27 1.71 0.57 0.49
Common stock price per share:
High 54.98 48.07 48.23 44.73
Low 44.38 43.00 42.37 39.60
UTILITY
Operating revenues (1) $ 4,308 $ 4,939 $ 3,951 $ 3,890
Operating income 383 1,059 525 485
Income tax provision 59 115 110 100
Net income (2) 162 793 250 228
Income available for common stock 158 790 246 225
Comprehensive income 154 793 250 228
2013
PG&E CORPORATION
Operating revenues $ 3,975 $ 4,175 $ 3,776 $ 3,672
Operating income 333 291 636 502
Income tax (benet) provision 25 (24) 153 114
Net income (2) 90 164 332 242
Income available for common shareholders 86 161 328 239
Comprehensive income 210 165 352 252
Net earnings per common share, basic 0.19 0.36 0.74 0.55
Net earnings per common share, diluted 0.19 0.36 0.74 0.55
Common stock price per share:
High 42.75 46.37 48.44 44.53
Low 40.07 40.76 43.59 40.47
UTILITY
Operating revenues $ 3,973 $ 4,174 $ 3,775 $ 3,671
Operating income 360 292 635 503
Income tax (benet) provision 65 (20) 160 121
Net income (2) 138 162 329 237
Income available for common stock 134 159 325 234
Comprehensive income 231 166 333 242
(1) In the third quarter 2014, the Utility recorded an increase to base revenues as authorized by the CPUC in the 2014 GRC decision.
(2) The Utility recorded a charge to net income of $116 million in the fourth quarter of 2014 and $196 million in the third quarter of 2013 for PSEP capital costs that
are forecasted to exceed the authorized amounts. (See Note 14 of the Notes to the Consolidated Financial Statements in Item 8.)