PG&E 2014 Annual Report Download - page 7
Download and view the complete annual report
Please find page 7 of the 2014 PG&E annual report below. You can navigate through the pages in the report by either clicking on the pages listed below, or by using the keyword search tool below to find specific information within the annual report.-
 1
1 -
 2
2 -
 3
3 -
 4
4 -
 5
5 -
 6
6 -
 7
7 -
 8
8 -
 9
9 -
 10
10 -
 11
11 -
 12
12 -
 13
13 -
 14
14 -
 15
15 -
 16
16 -
 17
17 -
 18
18 -
19
-
20
-
21
-
22
-
23
-
24
-
25
-
26
-
27
-
28
-
29
-
30
-
31
-
32
-
33
-
34
-
35
-
36
-
37
-
38
-
39
-
40
-
41
-
42
-
43
-
44
-
45
-
46
-
47
-
48
-
49
-
50
-
51
-
52
-
53
-
54
-
55
-
56
-
57
-
58
-
59
-
60
-
61
-
62
-
63
-
64
-
65
-
66
-
67
-
68
-
69
-
70
-
71
-
72
-
73
-
74
-
75
-
76
-
77
-
78
-
79
-
80
-
81
-
82
-
83
-
84
-
85
-
86
-
87
-
88
-
89
-
90
-
91
-
92
-
93
-
94
-
95
-
96
-
97
-
98
-
99
-
100
-
101
-
102
-
103
-
104
-
105
-
106
-
107
-
108
-
109
-
110
-
111
-
112
-
113
-
114
-
115
-
116
-
117
-
118
-
119
-
120
-
121
-
122
-
123
-
124
-
125
-
126
-
127
-
128
-
129
-
130
-
131
-
132
-
133
-
134
-
135
-
136
-
137
-
138
-
139
-
140
-
141
-
142
-
143
-
144
-
145
-
146
-
147
-
148
-
149
-
150
-
151
-
152
-
153
-
154
-
155
-
156
-
157
-
158
-
159
-
160
-
161
-
162
-
163
-
164
 |
 |

iii
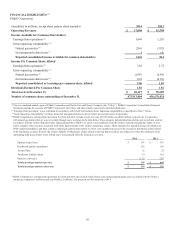
FINANCIAL HIGHLIGHTS (1)
PG&E Corporation
(unaudited, in millions, except share and per share amounts) 2014 2013
Operating Revenues $ 17,090 $ 15,598
Income Available for Common Shareholders
Earnings from operations (2) 1,648 1,210
Items impacting comparability (3)
Natural gas matters (4) (216) (392)
Environmental-related costs (5) 4 (4)
Reported consolidated income available for common shareholders 1,436 814
Income Per Common Share, diluted
Earnings from operations (2) 3.50 2.72
Items impacting comparability (3)
Natural gas matters (4) (0.45) (0.88)
Environmental-related costs (5) 0.01 (0.01)
Reported consolidated net earnings per common share, diluted 3.06 1.83
Dividends Declared Per Common Share 1.82 1.82
Total Assets at December 31, $ 60,127 $ 55,605
Number of common shares outstanding at December 31, 475,913,404 456,670,424
(1) This is a combined annual report of PG&E Corporation and Pacific Gas and Electric Company (the “Utility”). PG&E Corporation’s Consolidated Financial
Statements include the accounts of PG&E Corporation, the Utility, and other wholly owned and controlled subsidiaries.
(2) “Earnings from operations” is not calculated in accordance with GAAP and excludes items impacting comparability as described in Note (3) below.
(3) “Items impacting comparability” are those items that management believes do not reflect the normal course of operations.
(4) PG&E Corporation’s earnings from operations for 2014 and 2013 exclude net pre-tax costs of $356 million and $645 million, respectively, in connection
with natural gas matters that are not recoverable through rates, as shown in the table below. These amounts included pipeline-related costs to perform work in
accordance with the Utility’s Pipeline Safety Enhancement Plan (“PSEP”), to remove encroachments from the Utility’s transmission pipeline rights-of-way,
and to complete other activities associated with safety improvements to the Utility’s natural gas system. These amounts also included charges for disallowed
PSEP capital expenditures and fines related to natural gas enforcement matters. In 2013, costs included increases to the accrual for third-party claims related
to the San Bruno accident. In 2014, the Utility’s liability for third-party claims related to the San Bruno accident was reduced to reflect the settlement of all
outstanding third-party claims. Costs in both years were partially offset by insurance recoveries.
2014 2013
Pipeline-related costs $ 347 $ 387
Disallowed capital expenditures 116 196
Accrued fines 12 22
Third-party liability claims (7) 110
Insurance recoveries (112) (70)
Total natural gas matters (pre-tax) $ 356 $ 645
Total natural gas matters (after-tax) $ 216 $ 392
(5) PG&E Corporation’s earnings from operations for 2014 and 2013 also exclude whole house water replacement program costs associated with the Utility’s
natural gas compressor station located near Hinkley, California. The program was discontinued in 2014.