PG&E 2014 Annual Report Download - page 59
Download and view the complete annual report
Please find page 59 of the 2014 PG&E annual report below. You can navigate through the pages in the report by either clicking on the pages listed below, or by using the keyword search tool below to find specific information within the annual report.-
 1
1 -
2
-
3
-
4
-
5
-
6
-
7
-
8
-
9
-
10
-
11
-
12
-
13
-
14
-
15
-
16
-
17
-
18
-
19
-
20
-
21
-
22
-
23
-
24
-
25
-
26
-
27
-
28
-
29
-
30
-
31
-
32
-
33
-
34
-
35
-
36
-
37
-
38
-
39
-
40
-
41
-
42
-
43
-
44
-
45
-
46
-
47
-
48
-
 49
49 -
 50
50 -
 51
51 -
 52
52 -
 53
53 -
 54
54 -
 55
55 -
 56
56 -
 57
57 -
 58
58 -
 59
59 -
 60
60 -
 61
61 -
 62
62 -
 63
63 -
 64
64 -
 65
65 -
 66
66 -
 67
67 -
 68
68 -
 69
69 -
70
-
71
-
72
-
73
-
74
-
75
-
76
-
77
-
78
-
79
-
80
-
81
-
82
-
83
-
84
-
85
-
86
-
87
-
88
-
89
-
90
-
91
-
92
-
93
-
94
-
95
-
96
-
97
-
98
-
99
-
100
-
101
-
102
-
103
-
104
-
105
-
106
-
107
-
108
-
109
-
110
-
111
-
112
-
113
-
114
-
115
-
116
-
117
-
118
-
119
-
120
-
121
-
122
-
123
-
124
-
125
-
126
-
127
-
128
-
129
-
130
-
131
-
132
-
133
-
134
-
135
-
136
-
137
-
138
-
139
-
140
-
141
-
142
-
143
-
144
-
145
-
146
-
147
-
148
-
149
-
150
-
151
-
152
-
153
-
154
-
155
-
156
-
157
-
158
-
159
-
160
-
161
-
162
-
163
-
164
 |
 |

51
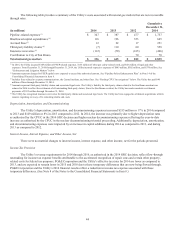
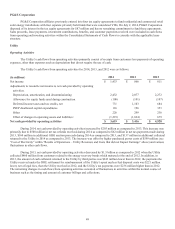
Financing Activities
The Utility’s financing activities are impacted by the conditions in the capital markets and the maturity date of existing
debt instruments. The Utility forecasts that its financing needs will increase as it incurs non-recoverable pipeline-related costs and
fines associated with the pending investigations and other enforcement matters.
The Utility’s cash flows from financing activities for 2014, 2013, and 2012 were as follows:
(in millions)2014 2013 2012
Net issuances (repayments) of commercial paper, net of discount $ (583) $ 542 $ (1,021)
Proceeds from issuance of short-term debt, net of issuance costs 300 - -
Proceeds from issuance of long-term debt, net of premium, discount, and
issuance costs 1,961 1,532 1,137
Short-term debt matured - - (250)
Repayments of long-term debt (539) (861) (50)
Energy recovery bonds matured - - (423)
Preferred stock dividends paid (14) (14) (14)
Common stock dividends paid (716) (716) (716)
Equity contribution from PG&E Corporation 705 1,140 885
Other 56 (26) 28
Netcashprovidedby(usedin)nancingactivities $ 1,170 $ 1,597 $ (424)
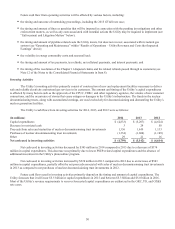
In 2014, net cash provided by financing activities decreased by $427 million compared to the same period in 2013. In
2013, net cash provided by financing activities increased by $2.0 billion compared to 2012. Cash provided by or used in financing
activities is driven by the Utility’s financing needs, which depends on the level of cash provided by or used in operating activities
and the level of cash provided by or used in investing activities.
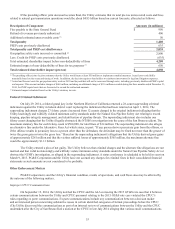
CONTRACTUAL COMMITMENTS
The following table provides information about PG&E Corporation’s and the Utility’s contractual commitments at
December 31, 2014:
Payment due by period
(in millions) Less Than 1-3 3-5 More Than
Utility 1 Year Years Years 5 Years Total
Long-term debt (1): $714 $2,304 $2,870 $21,779 $27,667
Purchase obligations (2):
Power purchase agreements: 3,566 6,839 6,239 33,896 50,540
Natural gas supply, transportation, and storage 544 271 214 648 1,677
Nuclear fuel agreements 138 260 224 429 1,051
Pension and other benets (3) 388 776 776 388 2,328
Operating leases (2) 44 76 57 183 360
Preferred dividends (4) 14 28 28 - 70
PG&E Corporation
Long-term debt (1): 8 16 359 - 383
Total Contractual Commitments $ 5,416 $ 10,570 $ 10,767 $ 57,323 $ 84,076
(1) Includes interest payments over the terms of the debt. Interest is calculated using the applicable interest rate at December 31, 2014 and outstanding principal for
each instrument with the terms ending at each instrument’s maturity. (See Note 4 of the Notes to the Consolidated Financial Statements in Item 8.)
(2) See Note 14 of the Notes to the Consolidated Financial Statements in Item 8.
(3) See Note 11 of the Notes to the Consolidated Financial Statements in Item 8. Payments into the pension and other benefits plans are based on annual contribution
requirements. As these annual requirements continue indefinitely into the future, the amount shown in the column entitled “more than 5 years” represents only
1 year of contributions for the Utility’s pension and other benefit plans.
(4) Based on historical performance, it is assumed for purposes of the table above that dividends are payable within a fixed period of five years.