PG&E 2014 Annual Report Download - page 57
Download and view the complete annual report
Please find page 57 of the 2014 PG&E annual report below. You can navigate through the pages in the report by either clicking on the pages listed below, or by using the keyword search tool below to find specific information within the annual report.-
 1
1 -
2
-
3
-
4
-
5
-
6
-
7
-
8
-
9
-
10
-
11
-
12
-
13
-
14
-
15
-
16
-
17
-
18
-
19
-
20
-
21
-
22
-
23
-
24
-
25
-
26
-
27
-
28
-
29
-
30
-
31
-
32
-
33
-
34
-
35
-
36
-
37
-
38
-
39
-
40
-
41
-
42
-
43
-
44
-
45
-
46
-
 47
47 -
 48
48 -
 49
49 -
 50
50 -
 51
51 -
 52
52 -
 53
53 -
 54
54 -
 55
55 -
 56
56 -
 57
57 -
 58
58 -
 59
59 -
 60
60 -
 61
61 -
 62
62 -
 63
63 -
 64
64 -
 65
65 -
 66
66 -
 67
67 -
68
-
69
-
70
-
71
-
72
-
73
-
74
-
75
-
76
-
77
-
78
-
79
-
80
-
81
-
82
-
83
-
84
-
85
-
86
-
87
-
88
-
89
-
90
-
91
-
92
-
93
-
94
-
95
-
96
-
97
-
98
-
99
-
100
-
101
-
102
-
103
-
104
-
105
-
106
-
107
-
108
-
109
-
110
-
111
-
112
-
113
-
114
-
115
-
116
-
117
-
118
-
119
-
120
-
121
-
122
-
123
-
124
-
125
-
126
-
127
-
128
-
129
-
130
-
131
-
132
-
133
-
134
-
135
-
136
-
137
-
138
-
139
-
140
-
141
-
142
-
143
-
144
-
145
-
146
-
147
-
148
-
149
-
150
-
151
-
152
-
153
-
154
-
155
-
156
-
157
-
158
-
159
-
160
-
161
-
162
-
163
-
164
 |
 |

49
PG&E Corporation
PG&E Corporation affiliates previously entered into four tax equity agreements to fund residential and commercial retail
solar energy installations with four separate privately held funds that were considered VIEs. On July 2, 2014, PG&E Corporation
disposed of its interest in the tax equity agreements for $87 million and has no remaining commitment to fund these agreements.
Sales proceeds, lease payments, investment contributions, benefits, and customer payments received were included in cash flows
from operating and investing activities within the Consolidated Statements of Cash Flows to coincide with the applicable lease
structure.
Utility
Operating Activities
The Utility’s cash flows from operating activities primarily consist of receipts from customers less payments of operating
expenses, other than expenses such as depreciation that do not require the use of cash.
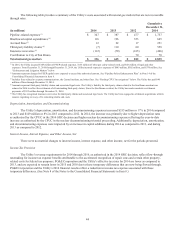
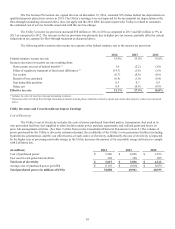
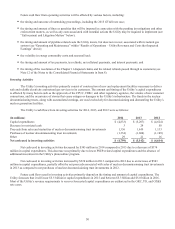
The Utility’s cash flows from operating activities for 2014, 2013, and 2012 were as follows:
(in millions)2014 2013 2012
Net income $1,433 $866 $811
Adjustments to reconcile net income to net cash provided by operating
activities:
Depreciation, amortization, and decommissioning 2,432 2,077 2,272
Allowance for equity funds used during construction (100) (101) (107)
Deferred income taxes and tax credits, net 731 1,103 684
PSEP disallowed capital expenditures 116 196 353
Other 226 299 236
Effect of changes in operating assets and liabilities: (1,219) (1,024) 679
Net cash provided by operating activities $ 3,619 $ 3,416 $ 4,928
During 2014, net cash provided by operating activities increased by $203 million as compared to 2013. This increase was
primarily due to $500 million in net tax refunds received during 2014 as compared to $62 million in net tax payments made during
2013, $160 million in additional GHG auction proceeds during 2014 as compared to 2013, and $137 million in additional collateral
returned to the Utility in 2014 as compared to 2013. The increase was offset by higher purchased power costs of $599 million (see
“Cost of Electricity” within “Results of Operations – Utility Revenues and Costs that did not Impact Earnings” above) and various
fluctuations in other cash flows.
During 2013, net cash provided by operating activities decreased by $1.5 billion as compared to 2012 when the Utility
collected $460 million from customers related to the energy recovery bonds which matured at the end of 2012. In addition, in
2013, the amount of cash collateral returned to the Utility by third parties was $243 million lower than in 2012, the payments the
Utility received under the DOE settlement for reimbursement of the Utility’s spent nuclear fuel disposal costs was $221 million
lower, net of legal fees, than the Utility received in 2012, and the Utility’s tax payments were $236 million higher than in 2012.
The remaining changes in cash flows from operating activities consisted of fluctuations in activities within the normal course of
business such as the timing and amount of customer billings and collections.