PG&E 2014 Annual Report Download - page 74
Download and view the complete annual report
Please find page 74 of the 2014 PG&E annual report below. You can navigate through the pages in the report by either clicking on the pages listed below, or by using the keyword search tool below to find specific information within the annual report.-
 1
1 -
2
-
3
-
4
-
5
-
6
-
7
-
8
-
9
-
10
-
11
-
12
-
13
-
14
-
15
-
16
-
17
-
18
-
19
-
20
-
21
-
22
-
23
-
24
-
25
-
26
-
27
-
28
-
29
-
30
-
31
-
32
-
33
-
34
-
35
-
36
-
37
-
38
-
39
-
40
-
41
-
42
-
43
-
44
-
45
-
46
-
47
-
48
-
49
-
50
-
51
-
52
-
53
-
54
-
55
-
56
-
57
-
58
-
59
-
60
-
61
-
62
-
63
-
 64
64 -
 65
65 -
 66
66 -
 67
67 -
 68
68 -
 69
69 -
 70
70 -
 71
71 -
 72
72 -
 73
73 -
 74
74 -
 75
75 -
 76
76 -
 77
77 -
 78
78 -
 79
79 -
 80
80 -
 81
81 -
 82
82 -
 83
83 -
 84
84 -
85
-
86
-
87
-
88
-
89
-
90
-
91
-
92
-
93
-
94
-
95
-
96
-
97
-
98
-
99
-
100
-
101
-
102
-
103
-
104
-
105
-
106
-
107
-
108
-
109
-
110
-
111
-
112
-
113
-
114
-
115
-
116
-
117
-
118
-
119
-
120
-
121
-
122
-
123
-
124
-
125
-
126
-
127
-
128
-
129
-
130
-
131
-
132
-
133
-
134
-
135
-
136
-
137
-
138
-
139
-
140
-
141
-
142
-
143
-
144
-
145
-
146
-
147
-
148
-
149
-
150
-
151
-
152
-
153
-
154
-
155
-
156
-
157
-
158
-
159
-
160
-
161
-
162
-
163
-
164
 |
 |

66
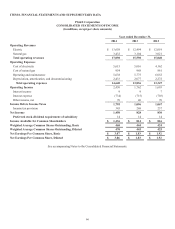
ITEM 8. FINANCIAL STATEMENTS AND SUPPLEMENTARY DATA
PG&E Corporation
CONSOLIDATED STATEMENTS OF INCOME
(in millions, except per share amounts)
Year ended December 31,
2014 2013 2012
Operating Revenues
Electric $13,658 $12,494 $12,019
Natural gas 3,432 3,104 3,021
Total operating revenues 17,090 15,598 15,040
Operating Expenses
Cost of electricity 5,615 5,016 4,162
Cost of natural gas 954 968 861
Operating and maintenance 5,638 5,775 6,052
Depreciation, amortization, and decommissioning 2,433 2,077 2,272
Total operating expenses 14,640 13,836 13,347
Operating Income 2,450 1,762 1,693
Interest income 9 9 7
Interest expense (734) (715) (703)
Other income, net 70 40 70
Income Before Income Taxes 1,795 1,096 1,067
Income tax provision 345 268 237
Net Income 1,450 828 830
Preferred stock dividend requirement of subsidiary 14 14 14
Income Available for Common Shareholders $ 1,436 $ 814 $ 816
Weighted Average Common Shares Outstanding, Basic 468 444 424
Weighted Average Common Shares Outstanding, Diluted 470 445 425
Net Earnings Per Common Share, Basic $ 3.07 $ 1.83 $ 1.92
Net Earnings Per Common Share, Diluted $ 3.06 $ 1.83 $ 1.92
See accompanying Notes to the Consolidated Financial Statements.