PG&E 2014 Annual Report Download - page 51
Download and view the complete annual report
Please find page 51 of the 2014 PG&E annual report below. You can navigate through the pages in the report by either clicking on the pages listed below, or by using the keyword search tool below to find specific information within the annual report.-
 1
1 -
2
-
3
-
4
-
5
-
6
-
7
-
8
-
9
-
10
-
11
-
12
-
13
-
14
-
15
-
16
-
17
-
18
-
19
-
20
-
21
-
22
-
23
-
24
-
25
-
26
-
27
-
28
-
29
-
30
-
31
-
32
-
33
-
34
-
35
-
36
-
37
-
38
-
39
-
40
-
 41
41 -
 42
42 -
 43
43 -
 44
44 -
 45
45 -
 46
46 -
 47
47 -
 48
48 -
 49
49 -
 50
50 -
 51
51 -
 52
52 -
 53
53 -
 54
54 -
 55
55 -
 56
56 -
 57
57 -
 58
58 -
 59
59 -
 60
60 -
 61
61 -
62
-
63
-
64
-
65
-
66
-
67
-
68
-
69
-
70
-
71
-
72
-
73
-
74
-
75
-
76
-
77
-
78
-
79
-
80
-
81
-
82
-
83
-
84
-
85
-
86
-
87
-
88
-
89
-
90
-
91
-
92
-
93
-
94
-
95
-
96
-
97
-
98
-
99
-
100
-
101
-
102
-
103
-
104
-
105
-
106
-
107
-
108
-
109
-
110
-
111
-
112
-
113
-
114
-
115
-
116
-
117
-
118
-
119
-
120
-
121
-
122
-
123
-
124
-
125
-
126
-
127
-
128
-
129
-
130
-
131
-
132
-
133
-
134
-
135
-
136
-
137
-
138
-
139
-
140
-
141
-
142
-
143
-
144
-
145
-
146
-
147
-
148
-
149
-
150
-
151
-
152
-
153
-
154
-
155
-
156
-
157
-
158
-
159
-
160
-
161
-
162
-
163
-
164
 |
 |

43
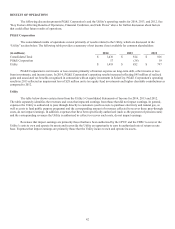
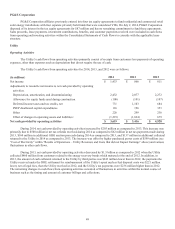
The Utility’s operating results for 2014 reflect the increase in authorized revenues effective January 1, 2014 that was
approved by the CPUC in the 2014 GRC decision issued on August 14, 2014. (See “Utility Revenues and Costs that Impacted
Earnings” below.)
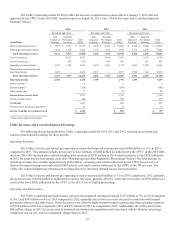
2014 2013 2012
Revenues and Costs: Revenues and Costs: Revenues and Costs:
(in millions)
That
Impacted
Earnings
That Did
Not Impact
Earnings
Total
Utility
That
Impacted
Earnings
That Did
Not Impact
Earnings
Total
Utility
That
Impacted
Earnings
That Did
Not Impact
Earnings
Total
Utility
Electric operating revenues $7,059 $6,597 $13,656 $6,465 $6,024 $12,489 $6,414 $5,600 $12,014
Natural gas operating revenues 2,072 1,360 3,432 1,776 1,328 3,104 1,772 1,249 3,021
Total operating revenues 9,131 7,957 17,088 8,241 7,352 15,593 8,186 6,849 15,035
Cost of electricity - 5,615 5,615 - 5,016 5,016 - 4,162 4,162
Cost of natural gas - 954 954 - 968 968 - 861 861
Operating and maintenance 4,247 1,388 5,635 4,374 1,368 5,742 4,563 1,482 6,045
Depreciation, amortization, and
decommissioning 2,432 - 2,432 2,077 - 2,077 1,928 344 2,272
Total operating expenses 6,679 7,957 14,636 6,451 7,352 13,803 6,491 6,849 13,340
Operating income 2,452 - 2,452 1,790 - 1,790 1,695 - 1,695
Interest income (1) 886
Interest expense (1) (720) (690) (680)
Other income, net (1) 77 84 88
Income before income taxes 1,817 1,192 1,109
Income tax provision (1) 384 326 298
Net income 1,433 866 811
Preferred stock dividend requirement (1) 14 14 14
Income Available for Common Stock $ 1,419 $ 852 $ 797
(1) These items impacted earnings.
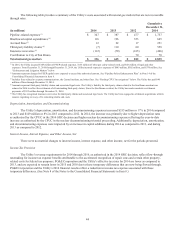
Utility Revenues and Costs that Impacted Earnings
The following discussion presents the Utility’s operating results for 2014, 2013 and 2012, focusing on revenues and
expenses that impacted earnings for these periods.
Operating Revenues
The Utility’s electric and natural gas operating revenues that impacted earnings increased $890 million or 11% in 2014
compared to 2013. This amount includes an increase to base revenues of $460 million as authorized by the CPUC in the 2014 GRC
decision. The GRC decision also resulted in higher base revenues of $150 million in 2014 related primarily to the DOE settlement
in 2012 for spent nuclear fuel storage costs. (See “Ratemaking and Other Regulatory Proceedings” below.) The total increase in
operating revenues also includes approximately $150 million, consisting of revenues authorized by the CPUC for recovery of
nuclear decommissioning costs and certain PSEP-related costs and revenues authorized by the FERC in the TO rate case. The
Utility also collected higher gas transmission revenues driven by increased demand for gas-fired generation.
The Utility’s electric and natural gas operating revenues increased $55 million or 1% in 2013 compared to 2012, primarily
due to an increase of $294 million as authorized in various rate cases, partially offset by a decrease in revenues of $196 million as a
result of the lower ROE authorized by the CPUC in the 2013 Cost of Capital proceeding.
Operating and Maintenance
The Utility’s operating and maintenance expenses that impacted earnings decreased $127 million or 3% in 2014 compared
to 2013 and $189 million or 4% in 2013 compared to 2012, primarily due to lower net costs incurred in connection with natural
gas matters shown in the table below. These decreases were offset by higher benefit-related expenses and other operating expenses
of $120 million in 2014 as compared to 2013 and $53 million in 2013 as compared to 2012. Additionally, the Utility incurred an
$88 million charge in 2012 for an increase in estimated environmental remediation costs associated with the Hinkley natural gas
compressor station site, with no comparable charge taken in 2013.