PG&E 2014 Annual Report Download - page 53
Download and view the complete annual report
Please find page 53 of the 2014 PG&E annual report below. You can navigate through the pages in the report by either clicking on the pages listed below, or by using the keyword search tool below to find specific information within the annual report.-
 1
1 -
2
-
3
-
4
-
5
-
6
-
7
-
8
-
9
-
10
-
11
-
12
-
13
-
14
-
15
-
16
-
17
-
18
-
19
-
20
-
21
-
22
-
23
-
24
-
25
-
26
-
27
-
28
-
29
-
30
-
31
-
32
-
33
-
34
-
35
-
36
-
37
-
38
-
39
-
40
-
41
-
42
-
 43
43 -
 44
44 -
 45
45 -
 46
46 -
 47
47 -
 48
48 -
 49
49 -
 50
50 -
 51
51 -
 52
52 -
 53
53 -
 54
54 -
 55
55 -
 56
56 -
 57
57 -
 58
58 -
 59
59 -
 60
60 -
 61
61 -
 62
62 -
 63
63 -
64
-
65
-
66
-
67
-
68
-
69
-
70
-
71
-
72
-
73
-
74
-
75
-
76
-
77
-
78
-
79
-
80
-
81
-
82
-
83
-
84
-
85
-
86
-
87
-
88
-
89
-
90
-
91
-
92
-
93
-
94
-
95
-
96
-
97
-
98
-
99
-
100
-
101
-
102
-
103
-
104
-
105
-
106
-
107
-
108
-
109
-
110
-
111
-
112
-
113
-
114
-
115
-
116
-
117
-
118
-
119
-
120
-
121
-
122
-
123
-
124
-
125
-
126
-
127
-
128
-
129
-
130
-
131
-
132
-
133
-
134
-
135
-
136
-
137
-
138
-
139
-
140
-
141
-
142
-
143
-
144
-
145
-
146
-
147
-
148
-
149
-
150
-
151
-
152
-
153
-
154
-
155
-
156
-
157
-
158
-
159
-
160
-
161
-
162
-
163
-
164
 |
 |

45
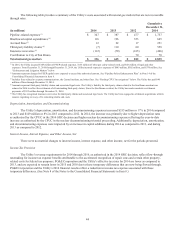
The Tax Increase Prevention Act, signed into law on December 19, 2014, extended 50% bonus federal tax depreciation on
qualified property placed into service in 2014. The Utility’s earnings were not impacted by the incremental tax depreciation as the
flow-through ratemaking discussed above does not apply and the 2014 GRC decision requires the Utility to refund to customers
the estimated cost of service benefits associated with this tax law change.
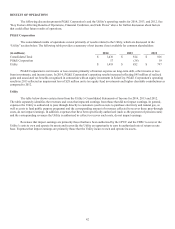
The Utility’s income tax provision increased $58 million or 18% in 2014 as compared to 2013 and $28 million or 9% in
2013 as compared to 2012. The increase in the tax provision was primarily due to higher pre-tax income, partially offset by certain
reductions in tax expense for flow-through treatment as discussed above.
The following table reconciles the income tax expense at the federal statutory rate to the income tax provision:
2014 2013 2012
Federal statutory income tax rate 35.0% 35.0% 35.0%
Increase (decrease) in income tax rate resulting from:
State income tax (net of federal benet) (1) 1.6 (2.2) (3.0)
Effect of regulatory treatment of xed asset differences (2) (14.7) (3.8) (3.9)
Tax credits (0.7) (0.4) (0.6)
Benet of loss carryback (0.8) (1.0) (0.4)
Non deductible penalties 0.3 0.7 0.5
Other, net 0.4 (0.9) (0.8)
Effective tax rate 21.1% 27.4% 26.8%
(1) Includes the effect of state flow-through ratemaking treatment.
(2) Represents effect of federal flow-through ratemaking treatment including those deductions related to repairs and certain other property-related costs discussed
above.
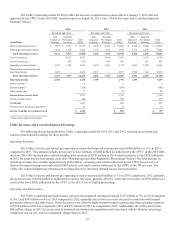
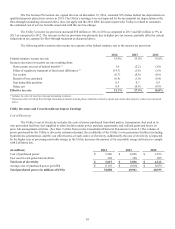
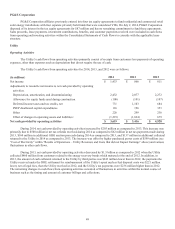
Utility Revenues and Costs that did not Impact Earnings
Cost of Electricity
The Utility’s cost of electricity includes the costs of power purchased from third parties, transmission, fuel used in its
own generation facilities, fuel supplied to other facilities under power purchase agreements, and realized gains and losses on
price risk management activities. (See Note 9 of the Notes to the Consolidated Financial Statements in Item 8.) The volume of
power purchased by the Utility is driven by customer demand, the availability of the Utility’s own generation facilities (including
hydroelectric generations), and the cost effectiveness of each source of electricity. Additionally, the cost of electricity is impacted
by the higher cost of procuring renewable energy as the Utility increases the amount of its renewable energy deliveries to comply
with California law.
(in millions)2014 2013 2012
Cost of purchased power $5,266 $4,696 $3,873
Fuel used in own generation facilities 349 320 289
Total cost of electricity $ 5,615 $ 5,016 $ 4,162
Average cost of purchased power per kWh $ 0.101 $ 0.094 $ 0.079
Total purchased power (in millions of kWh) 52,008 49,941 48,933