PG&E 2014 Annual Report Download - page 103
Download and view the complete annual report
Please find page 103 of the 2014 PG&E annual report below. You can navigate through the pages in the report by either clicking on the pages listed below, or by using the keyword search tool below to find specific information within the annual report.-
 1
1 -
2
-
3
-
4
-
5
-
6
-
7
-
8
-
9
-
10
-
11
-
12
-
13
-
14
-
15
-
16
-
17
-
18
-
19
-
20
-
21
-
22
-
23
-
24
-
25
-
26
-
27
-
28
-
29
-
30
-
31
-
32
-
33
-
34
-
35
-
36
-
37
-
38
-
39
-
40
-
41
-
42
-
43
-
44
-
45
-
46
-
47
-
48
-
49
-
50
-
51
-
52
-
53
-
54
-
55
-
56
-
57
-
58
-
59
-
60
-
61
-
62
-
63
-
64
-
65
-
66
-
67
-
68
-
69
-
70
-
71
-
72
-
73
-
74
-
75
-
76
-
77
-
78
-
79
-
80
-
81
-
82
-
83
-
84
-
85
-
86
-
87
-
88
-
89
-
90
-
91
-
92
-
 93
93 -
 94
94 -
 95
95 -
 96
96 -
 97
97 -
 98
98 -
 99
99 -
 100
100 -
 101
101 -
 102
102 -
 103
103 -
 104
104 -
 105
105 -
 106
106 -
 107
107 -
 108
108 -
 109
109 -
 110
110 -
 111
111 -
 112
112 -
 113
113 -
114
-
115
-
116
-
117
-
118
-
119
-
120
-
121
-
122
-
123
-
124
-
125
-
126
-
127
-
128
-
129
-
130
-
131
-
132
-
133
-
134
-
135
-
136
-
137
-
138
-
139
-
140
-
141
-
142
-
143
-
144
-
145
-
146
-
147
-
148
-
149
-
150
-
151
-
152
-
153
-
154
-
155
-
156
-
157
-
158
-
159
-
160
-
161
-
162
-
163
-
164
 |
 |

95
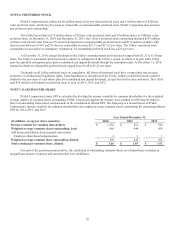
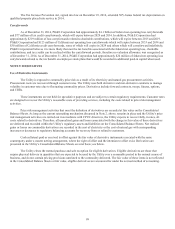
NOTE 6: PREFERRED STOCK
PG&E Corporation has authorized 80 million shares of no par value preferred stock and 5 million shares of $100 par
value preferred stock, which may be issued as redeemable or nonredeemable preferred stock. PG&E Corporation does not have
any preferred stock outstanding.
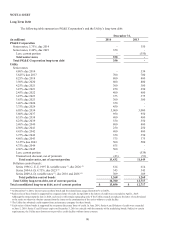
The Utility has authorized 75 million shares of $25 par value preferred stock and 10 million shares of $100 par value
preferred stock. At December 31, 2014 and December 31, 2013, the Utility’s preferred stock outstanding included $145 million
of shares with interest rates between 5% and 6% designated as nonredeemable preferred stock and $113 million of shares with
interest rates between 4.36% and 5% that are redeemable between $25.75 and $27.25 per share. The Utility’s preferred stock
outstanding are not subject to mandatory redemption. All outstanding preferred stock has a $25 par value.
At December 31, 2014, annual dividends on the Utility’s nonredeemable preferred stock ranged from $1.25 to $1.50 per
share. The Utility’s redeemable preferred stock is subject to redemption at the Utility’s option, in whole or in part, if the Utility
pays the specified redemption price plus accumulated and unpaid dividends through the redemption date. At December 31, 2014,
annual dividends on redeemable preferred stock ranged from $1.09 to $1.25 per share.
Dividends on all Utility preferred stock are cumulative. All shares of preferred stock have voting rights and an equal
preference in dividend and liquidation rights. Upon liquidation or dissolution of the Utility, holders of preferred stock would be
entitled to the par value of such shares plus all accumulated and unpaid dividends, as specified for the class and series. The Utility
paid $14 million of dividends on preferred stock in each of 2014, 2013, and 2012.
NOTE 7: EARNINGS PER SHARE
PG&E Corporation’s basic EPS is calculated by dividing the income available for common shareholders by the weighted
average number of common shares outstanding. PG&E Corporation applies the treasury stock method of reflecting the dilutive
effect of outstanding share-based compensation in the calculation of diluted EPS. The following is a reconciliation of PG&E
Corporation’s income available for common shareholders and weighted average common shares outstanding for calculating diluted
EPS for 2014, 2013, and 2012.
Year Ended December 31,
(in millions, except per share amounts) 2014 2013 2012
Income available for common shareholders $ 1,436 $ 814 $ 816
Weighted average common shares outstanding, basic 468 444 424
Add incremental shares from assumed conversions:
Employee share-based compensation 211
Weighted average common share outstanding, diluted 470 445 425
Total earnings per common share, diluted $ 3.06 $ 1.83 $ 1.92
For each of the periods presented above, the calculation of outstanding common shares on a diluted basis excluded an
insignificant amount of options and securities that were antidilutive.