PG&E 2014 Annual Report Download - page 157
Download and view the complete annual report
Please find page 157 of the 2014 PG&E annual report below. You can navigate through the pages in the report by either clicking on the pages listed below, or by using the keyword search tool below to find specific information within the annual report.-
 1
1 -
2
-
3
-
4
-
5
-
6
-
7
-
8
-
9
-
10
-
11
-
12
-
13
-
14
-
15
-
16
-
17
-
18
-
19
-
20
-
21
-
22
-
23
-
24
-
25
-
26
-
27
-
28
-
29
-
30
-
31
-
32
-
33
-
34
-
35
-
36
-
37
-
38
-
39
-
40
-
41
-
42
-
43
-
44
-
45
-
46
-
47
-
48
-
49
-
50
-
51
-
52
-
53
-
54
-
55
-
56
-
57
-
58
-
59
-
60
-
61
-
62
-
63
-
64
-
65
-
66
-
67
-
68
-
69
-
70
-
71
-
72
-
73
-
74
-
75
-
76
-
77
-
78
-
79
-
80
-
81
-
82
-
83
-
84
-
85
-
86
-
87
-
88
-
89
-
90
-
91
-
92
-
93
-
94
-
95
-
96
-
97
-
98
-
99
-
100
-
101
-
102
-
103
-
104
-
105
-
106
-
107
-
108
-
109
-
110
-
111
-
112
-
113
-
114
-
115
-
116
-
117
-
118
-
119
-
120
-
121
-
122
-
123
-
124
-
125
-
126
-
127
-
128
-
129
-
130
-
131
-
132
-
133
-
134
-
135
-
136
-
137
-
138
-
139
-
140
-
141
-
142
-
143
-
144
-
145
-
146
-
 147
147 -
 148
148 -
 149
149 -
 150
150 -
 151
151 -
 152
152 -
 153
153 -
 154
154 -
 155
155 -
 156
156 -
 157
157 -
 158
158 -
 159
159 -
 160
160 -
 161
161 -
 162
162 -
 163
163 -
 164
164
 |
 |

149
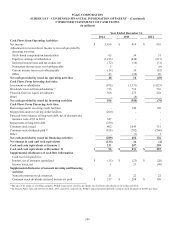
PG&E CORPORATION
SCHEDULE I – CONDENSED FINANCIAL INFORMATION OF PARENT – (Continued)
CONDENSED STATEMENTS OF CASH FLOWS
(in millions)
Year Ended December 31,
2014 2013 2012
Cash Flows from Operating Activities:
Net income $ 1,436 $ 814 $ 816
Adjustments to reconcile net income to net cash provided by
operating activities:
Stock-based compensation amortization 65 54 51
Equity in earnings of subsidiaries (1,413) (848) (817)
Deferred income taxes and tax credits, net (72) (10) (31)
Noncurrent income taxes receivable/payable 5 - (6)
Current income taxes receivable/payable (16) 20 (82)
Other 43 (20) 20
Net cash provided by (used in) operating activities 48 10 (49)
Cash Flows From Investing Activities:
Investment in subsidiaries (978) (1,371) (1,023)
Dividends received from subsidiaries (1) 716 716 716
Proceeds from tax equity investments 368 275 228
Other - (8) -
Net cash provided by (used in) investing activities 106 (388) (79)
Cash Flows From Financing Activities:
Borrowings under revolving credit facilities - 140 120
Repayments under revolving credit facilities (260) - -
Proceeds from issuance of long-term debt, net of discount and
issuance costs of $3 in 2014 347 - -
Repayments of long-term debt (350) - -
Common stock issued 802 1,045 751
Common stock dividends paid (2) (828) (782) (746)
Other - (1) 1
Net cash provided by (used in) financing activities (289) 402 126
Net change in cash and cash equivalents (135) 24 (2)
Cash and cash equivalents at January 1 231 207 209
Cash and cash equivalents at December 31 $ 96 $ 231 $ 207
Supplemental disclosures of cash flow information
Cash received (paid) for:
Interest, net of amounts capitalized $ (15) $ (23) $ (20)
Income taxes, net 1 21 (60)
Supplemental disclosures of noncash investing and financing
activities
Noncash common stock issuances 21 22 22
Common stock dividends declared but not yet paid $ 217 $ 208 $ 196
(1) Because of its nature as a holding company, PG&E Corporation classifies dividends received from subsidiaries an investing cash flow.
(2) In January, April, July, and October of 2014, 2013, and 2012, respectively, PG&E Corporation paid quarterly common stock dividends of $0.455 per share.