PG&E 2014 Annual Report Download - page 115
Download and view the complete annual report
Please find page 115 of the 2014 PG&E annual report below. You can navigate through the pages in the report by either clicking on the pages listed below, or by using the keyword search tool below to find specific information within the annual report.-
 1
1 -
2
-
3
-
4
-
5
-
6
-
7
-
8
-
9
-
10
-
11
-
12
-
13
-
14
-
15
-
16
-
17
-
18
-
19
-
20
-
21
-
22
-
23
-
24
-
25
-
26
-
27
-
28
-
29
-
30
-
31
-
32
-
33
-
34
-
35
-
36
-
37
-
38
-
39
-
40
-
41
-
42
-
43
-
44
-
45
-
46
-
47
-
48
-
49
-
50
-
51
-
52
-
53
-
54
-
55
-
56
-
57
-
58
-
59
-
60
-
61
-
62
-
63
-
64
-
65
-
66
-
67
-
68
-
69
-
70
-
71
-
72
-
73
-
74
-
75
-
76
-
77
-
78
-
79
-
80
-
81
-
82
-
83
-
84
-
85
-
86
-
87
-
88
-
89
-
90
-
91
-
92
-
93
-
94
-
95
-
96
-
97
-
98
-
99
-
100
-
101
-
102
-
103
-
104
-
 105
105 -
 106
106 -
 107
107 -
 108
108 -
 109
109 -
 110
110 -
 111
111 -
 112
112 -
 113
113 -
 114
114 -
 115
115 -
 116
116 -
 117
117 -
 118
118 -
 119
119 -
 120
120 -
 121
121 -
 122
122 -
 123
123 -
 124
124 -
 125
125 -
126
-
127
-
128
-
129
-
130
-
131
-
132
-
133
-
134
-
135
-
136
-
137
-
138
-
139
-
140
-
141
-
142
-
143
-
144
-
145
-
146
-
147
-
148
-
149
-
150
-
151
-
152
-
153
-
154
-
155
-
156
-
157
-
158
-
159
-
160
-
161
-
162
-
163
-
164
 |
 |

107
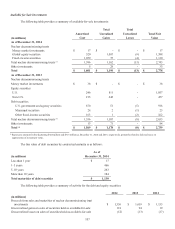
Available for Sale Investments
The following table provides a summary of available-for-sale investments:
Total Total
Amortized Unrealized Unrealized Total Fair
(in millions) Cost Gains Losses Value
As of December 31, 2014
Nuclear decommissioning trusts
Money market investments $ 17 $ - $ - $ 17
Global equity securities 520 1,087 (9) 1,598
Fixed-income securities 1,059 75 (4) 1,130
Total nuclear decommissioning trusts (1) 1,596 1,162 (13) 2,745
Other investments 5 28 - 33
Total $ 1,601 $ 1,190 $ (13) $ 2,778
As of December 31, 2013
Nuclear decommissioning trusts
Money market investments $ 38 $ - $ - $ 38
Equity securities
U.S. 246 811 - 1,057
Non-U.S. 215 242 - 457
Debt securities
U.S. government and agency securities 870 51 (5) 916
Municipal securities 24 2 (1) 25
Other xed-income securities 163 1 (2) 162
Total nuclear decommissioning trusts (1) 1,556 1,107 (8) 2,655
Other investments 13 71 - 84
Total (1) $ 1,569 $ 1,178 $ (8) $ 2,739
(1) Represents amounts before deducting $324 million and $313 million at December 31, 2014 and 2013, respectively, primarily related to deferred taxes on
appreciation of investment value.
The fair value of debt securities by contractual maturity is as follows:
As of
(in millions) December 31, 2014
Less than 1 year $ 17
1–5 years 466
5–10 years 263
More than 10 years 384
Total maturities of debt securities $ 1,130
The following table provides a summary of activity for the debt and equity securities:
2014 2013 2012
(in millions)
Proceeds from sales and maturities of nuclear decommissioning trust
investments $ 1,336 $ 1,619 $ 1,133
Gross realized gains on sales of securities held as available-for-sale 118 94 19
Gross realized losses on sales of securities held as available-for-sale (12) (13) (17)