PG&E 2014 Annual Report Download - page 67
Download and view the complete annual report
Please find page 67 of the 2014 PG&E annual report below. You can navigate through the pages in the report by either clicking on the pages listed below, or by using the keyword search tool below to find specific information within the annual report.-
 1
1 -
2
-
3
-
4
-
5
-
6
-
7
-
8
-
9
-
10
-
11
-
12
-
13
-
14
-
15
-
16
-
17
-
18
-
19
-
20
-
21
-
22
-
23
-
24
-
25
-
26
-
27
-
28
-
29
-
30
-
31
-
32
-
33
-
34
-
35
-
36
-
37
-
38
-
39
-
40
-
41
-
42
-
43
-
44
-
45
-
46
-
47
-
48
-
49
-
50
-
51
-
52
-
53
-
54
-
55
-
56
-
 57
57 -
 58
58 -
 59
59 -
 60
60 -
 61
61 -
 62
62 -
 63
63 -
 64
64 -
 65
65 -
 66
66 -
 67
67 -
 68
68 -
 69
69 -
 70
70 -
 71
71 -
 72
72 -
 73
73 -
 74
74 -
 75
75 -
 76
76 -
 77
77 -
78
-
79
-
80
-
81
-
82
-
83
-
84
-
85
-
86
-
87
-
88
-
89
-
90
-
91
-
92
-
93
-
94
-
95
-
96
-
97
-
98
-
99
-
100
-
101
-
102
-
103
-
104
-
105
-
106
-
107
-
108
-
109
-
110
-
111
-
112
-
113
-
114
-
115
-
116
-
117
-
118
-
119
-
120
-
121
-
122
-
123
-
124
-
125
-
126
-
127
-
128
-
129
-
130
-
131
-
132
-
133
-
134
-
135
-
136
-
137
-
138
-
139
-
140
-
141
-
142
-
143
-
144
-
145
-
146
-
147
-
148
-
149
-
150
-
151
-
152
-
153
-
154
-
155
-
156
-
157
-
158
-
159
-
160
-
161
-
162
-
163
-
164
 |
 |

59
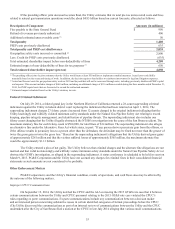
Interest Rate Risk
Interest rate risk sensitivity analysis is used to measure interest rate risk by computing estimated changes in cash flows
as a result of assumed changes in market interest rates. At December 31, 2014 and December 31, 2013, if interest rates changed
by 1% for all PG&E Corporation and Utility variable rate long-term debt, short-term debt, and cash investments, the impact on
net income over the next 12 months would be $9 million and $11 million, respectively, based on net variable rate debt and other
interest rate-sensitive instruments outstanding.
Energy Procurement Credit Risk
The Utility conducts business with counterparties mainly in the energy industry, including the CAISO market, other
California investor-owned electric utilities, municipal utilities, energy trading companies, financial institutions, electricity
generation companies, and oil and natural gas production companies located in the United States and Canada. If a counterparty
fails to perform on its contractual obligation to deliver electricity or gas, then the Utility may find it necessary to procure electricity
or gas at current market prices, which may be higher than the contract prices.
The Utility manages credit risk associated with its counterparties by assigning credit limits based on evaluations of their
financial conditions, net worth, credit ratings, and other credit criteria as deemed appropriate. Credit limits and credit quality are
monitored periodically. The Utility ties many energy contracts to master commodity enabling agreements that may require security
(referred to as “Credit Collateral” in the table below). Credit collateral may be in the form of cash or letters of credit. The Utility
may accept other forms of performance assurance in the form of corporate guarantees of acceptable credit quality or other eligible
securities (as deemed appropriate by the Utility). Credit collateral or performance assurance may be required from counterparties
when current net receivables and replacement cost exposure exceed contractually specified limits.
The following table summarizes the Utility’s credit risk exposure to its counterparties as of December 31, 2014 and
December 31, 2013:
Net Credit
Number of Exposure to
Gross Credit Wholesale Wholesale
Exposure Customers or Customers or
Before Credit Credit Net Credit Counterparties Counterparties
(in millions) Collateral (1) Collateral Exposure (2) >10% >10%
December 31, 2014 $88 $ (18) $ 70 3 29
December 31, 2013 87 $ (9) $ 78 2 34
(1) Gross credit exposure equals mark-to-market value on physically and financially settled contracts, and net receivables (payables) where netting is contractually
allowed. Gross and net credit exposure amounts reported above do not include adjustments for time value or liquidity.
(2) Net credit exposure is the Gross Credit Exposure Before Credit Collateral minus Credit Collateral (cash deposits and letters of credit posted by counterparties and
held by the Utility). For purposes of this table, parental guarantees are not included as part of the calculation.
CRITICAL ACCOUNTING POLICIES
The preparation of Consolidated Financial Statements in accordance with GAAP involves the use of estimates and
assumptions that affect the recorded amounts of assets and liabilities as of the date of the financial statements and the reported
amounts of revenues and expenses during the reporting period. The accounting policies described below are considered to be
critical accounting policies due, in part, to their complexity and because their application is relevant and material to the financial
position and results of operations of PG&E Corporation and the Utility, and because these policies require the use of material
judgments and estimates. Actual results may differ substantially from these estimates. These policies and their key characteristics
are outlined below.
Regulatory Accounting
The Utility’s rates are primarily set by the CPUC and the FERC and are designed to recover the cost of providing
service. The Utility capitalizes and records, as regulatory assets, costs that would otherwise be charged to expense if it is probable
that the incurred costs will be recovered in future rates. Regulatory assets are amortized over the future periods that the costs
are expected to be recovered. If costs expected to be incurred in the future are currently being recovered through rates, the Utility