PG&E 2014 Annual Report Download - page 21
Download and view the complete annual report
Please find page 21 of the 2014 PG&E annual report below. You can navigate through the pages in the report by either clicking on the pages listed below, or by using the keyword search tool below to find specific information within the annual report.-
 1
1 -
2
-
3
-
4
-
5
-
6
-
7
-
8
-
9
-
10
-
 11
11 -
 12
12 -
 13
13 -
 14
14 -
 15
15 -
 16
16 -
 17
17 -
 18
18 -
 19
19 -
 20
20 -
 21
21 -
 22
22 -
 23
23 -
 24
24 -
 25
25 -
 26
26 -
 27
27 -
 28
28 -
 29
29 -
 30
30 -
 31
31 -
32
-
33
-
34
-
35
-
36
-
37
-
38
-
39
-
40
-
41
-
42
-
43
-
44
-
45
-
46
-
47
-
48
-
49
-
50
-
51
-
52
-
53
-
54
-
55
-
56
-
57
-
58
-
59
-
60
-
61
-
62
-
63
-
64
-
65
-
66
-
67
-
68
-
69
-
70
-
71
-
72
-
73
-
74
-
75
-
76
-
77
-
78
-
79
-
80
-
81
-
82
-
83
-
84
-
85
-
86
-
87
-
88
-
89
-
90
-
91
-
92
-
93
-
94
-
95
-
96
-
97
-
98
-
99
-
100
-
101
-
102
-
103
-
104
-
105
-
106
-
107
-
108
-
109
-
110
-
111
-
112
-
113
-
114
-
115
-
116
-
117
-
118
-
119
-
120
-
121
-
122
-
123
-
124
-
125
-
126
-
127
-
128
-
129
-
130
-
131
-
132
-
133
-
134
-
135
-
136
-
137
-
138
-
139
-
140
-
141
-
142
-
143
-
144
-
145
-
146
-
147
-
148
-
149
-
150
-
151
-
152
-
153
-
154
-
155
-
156
-
157
-
158
-
159
-
160
-
161
-
162
-
163
-
164
 |
 |

13
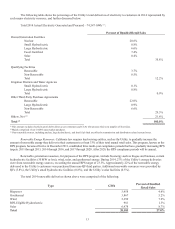
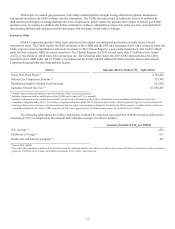
The following table shows the percentage of the Utility’s total deliveries of electricity to customers in 2014 represented by
each major electricity resource, and further discussed below.
Total 2014 Actual Electricity Generated and Procured – 74,547 GWh (1):
Percent of Bundled Retail Sales
Owned Generation Facilities
Nuclear 20.6%
Small Hydroelectric 0.8%
Large Hydroelectric 6.6%
Fossil fuel-red 7.4%
Solar 0.4%
Total 35.8%
Qualifying Facilities
Renewable 3.7%
Non-Renewable 8.5%
Total 12.2%
Irrigation Districts and Water Agencies
Small Hydroelectric 0.1%
Large Hydroelectric 0.8%
Total 0.9%
Other Third-Party Purchase Agreements
Renewable 22.0%
Large Hydroelectric 0.9%
Non-Renewable 6.6%
Total 29.5%
Others, Net (2) 21.6%
Total (3) 100.0%
(1) This amount excludes electricity provided to direct access customers and CCAs who procure their own supplies of electricity.
(2) Mainly comprised of net CAISO open market purchases.
(3) Non-renewable sources, including nuclear, large hydroelectric, and fossil fuel-fired are offset by transmission and distribution related system losses.
Renewable Energy Resources. California law requires load-serving entities, such as the Utility, to gradually increase the
amount of renewable energy they deliver to their customers to at least 33% of their total annual retail sales. This program, known as the
RPS program, became effective in December 2011, established three multi-year compliance periods that have gradually increasing RPS
targets: 2011 through 2013, 2014 through 2016, and 2017 through 2020. After 2020, the RPS compliance periods will be annual.
Renewable generation resources, for purposes of the RPS program, include bioenergy such as biogas and biomass, certain
hydroelectric facilities (30 MW or less), wind, solar, and geothermal energy. During 2014, 27% of the Utility’s energy deliveries
were from renewable energy sources, exceeding the annual RPS target of 23.3%. Approximately 22% of the renewable energy
delivered to the Utility’s customers was purchased from non-QF third parties. Additional renewable resources were provided by
QFs (3.8%), the Utility’s small hydroelectric facilities (0.8%), and the Utility’s solar facilities (0.5%).
The total 2014 renewable deliveries shown above were comprised of the following:
TypeGWh Percent of Bundled
Retail Sales
Biopower 3,458 4.6%
Geothermal 3,867 5.2%
Wind 5,399 7.2%
RPS-Eligible Hydroelectric 981 1.3%
Solar 6,478 8.7%
Total 20,183 27.0%