PG&E 2014 Annual Report Download - page 52
Download and view the complete annual report
Please find page 52 of the 2014 PG&E annual report below. You can navigate through the pages in the report by either clicking on the pages listed below, or by using the keyword search tool below to find specific information within the annual report.-
 1
1 -
2
-
3
-
4
-
5
-
6
-
7
-
8
-
9
-
10
-
11
-
12
-
13
-
14
-
15
-
16
-
17
-
18
-
19
-
20
-
21
-
22
-
23
-
24
-
25
-
26
-
27
-
28
-
29
-
30
-
31
-
32
-
33
-
34
-
35
-
36
-
37
-
38
-
39
-
40
-
41
-
 42
42 -
 43
43 -
 44
44 -
 45
45 -
 46
46 -
 47
47 -
 48
48 -
 49
49 -
 50
50 -
 51
51 -
 52
52 -
 53
53 -
 54
54 -
 55
55 -
 56
56 -
 57
57 -
 58
58 -
 59
59 -
 60
60 -
 61
61 -
 62
62 -
63
-
64
-
65
-
66
-
67
-
68
-
69
-
70
-
71
-
72
-
73
-
74
-
75
-
76
-
77
-
78
-
79
-
80
-
81
-
82
-
83
-
84
-
85
-
86
-
87
-
88
-
89
-
90
-
91
-
92
-
93
-
94
-
95
-
96
-
97
-
98
-
99
-
100
-
101
-
102
-
103
-
104
-
105
-
106
-
107
-
108
-
109
-
110
-
111
-
112
-
113
-
114
-
115
-
116
-
117
-
118
-
119
-
120
-
121
-
122
-
123
-
124
-
125
-
126
-
127
-
128
-
129
-
130
-
131
-
132
-
133
-
134
-
135
-
136
-
137
-
138
-
139
-
140
-
141
-
142
-
143
-
144
-
145
-
146
-
147
-
148
-
149
-
150
-
151
-
152
-
153
-
154
-
155
-
156
-
157
-
158
-
159
-
160
-
161
-
162
-
163
-
164
 |
 |

44
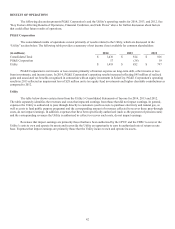
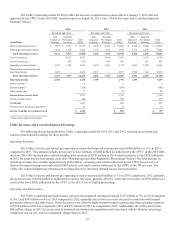
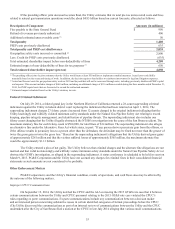
The following table provides a summary of the Utility’s costs associated with natural gas matters that are not recoverable
through rates:
(in millions)2014 2013 2012
Cumulative
December 31,
2014
Pipeline-related expenses (1) $347 $387 $477 $1,757
Disallowed capital expenditures (2) 116 196 353 665
Accrued nes (3) 12 22 17 251
Third-party liability claims (4) (7) 110 80 558
Insurance recoveries (5) (112) (70) (185) (466)
Contribution to City of San Bruno - - 70 70
Total natural gas matters $ 356 $ 645 $ 812 $ 2,835
(1) In 2014, the Utility incurred $149 million of PSEP-related expenses, $155 million of other gas safety-related work, and $43 million of legal and other
expenses. From December 31, 2010 through December 31, 2014, the Utility incurred respective expenses of $885 million, $502 million, and $370 million. See
“Enforcement and Litigation Matters” below.
(2) Amounts represent charges for PSEP capital costs expected to exceed the authorized amount. See “Pipeline Safety Enhancement Plan” in Note 14 of the
Consolidated Financial Statements in Item 8.
(3) Includes fines related to ex parte communications, the Carmel incident, and other fines. See “Pending CPUC Investigations” below. The Utility has paid $40
million of fines through December 31, 2014.
(4) Amounts represent third-party liability claims and associated legal costs. The Utility’s liability for third-party claims related to the San Bruno accident was
reduced in 2014 to reflect the settlement of all outstanding third-party claims. Since the San Bruno accident, the Utility has made cumulative settlement
payments of $532 million through December 31, 2014.
(5) The Utility has recognized insurance recoveries for third-party claims and associated legal costs. The Utility has been engaged in settlement negotiations with its
insurers regarding recovery of its remaining claims and costs.
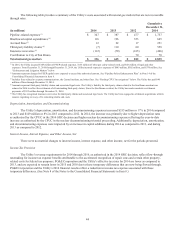
Depreciation, Amortization, and Decommissioning
The Utility’s depreciation, amortization, and decommissioning expenses increased $355 million or 17% in 2014 compared
to 2013 and $149 million or 8% in 2013 compared to 2012. In 2014, the increase was primarily due to higher depreciation rates
as authorized by the CPUC in the 2014 GRC decision and higher nuclear decommissioning expense reflecting the year-to-date
increase as authorized by the CPUC in the nuclear decommissioning triennial proceeding. Additionally, depreciation, amortization,
and decommissioning expenses were impacted by an increase in capital additions during 2014 as compared to 2013, and during
2013 as compared to 2012.
Interest Income, Interest Expense, and Other Income, Net
There were no material changes to interest income, interest expense, and other income, net for the periods presented.
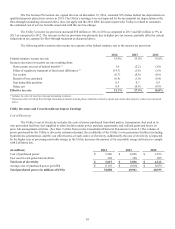
Income Tax Provision
The Utility’s revenue requirements for 2014 through 2016, as authorized in the 2014 GRC decision, reflect flow-through
ratemaking for income tax expense benefits attributable to the accelerated recognition of repair costs and certain other property-
related costs for federal tax purposes. PG&E Corporation and the Utility’s effective tax rates for 2014 are lower as compared to
2013, and are expected to remain lower in 2015 and 2016 due to these temporary differences that are now being flowed through.
PG&E Corporation and the Utility’s 2014 financial results reflect a reduction in income tax expense associated with these
temporary differences. (See Note 8 of the Notes to the Consolidated Financial Statements in Item 8.)