PG&E 2014 Annual Report Download - page 112
Download and view the complete annual report
Please find page 112 of the 2014 PG&E annual report below. You can navigate through the pages in the report by either clicking on the pages listed below, or by using the keyword search tool below to find specific information within the annual report.-
 1
1 -
2
-
3
-
4
-
5
-
6
-
7
-
8
-
9
-
10
-
11
-
12
-
13
-
14
-
15
-
16
-
17
-
18
-
19
-
20
-
21
-
22
-
23
-
24
-
25
-
26
-
27
-
28
-
29
-
30
-
31
-
32
-
33
-
34
-
35
-
36
-
37
-
38
-
39
-
40
-
41
-
42
-
43
-
44
-
45
-
46
-
47
-
48
-
49
-
50
-
51
-
52
-
53
-
54
-
55
-
56
-
57
-
58
-
59
-
60
-
61
-
62
-
63
-
64
-
65
-
66
-
67
-
68
-
69
-
70
-
71
-
72
-
73
-
74
-
75
-
76
-
77
-
78
-
79
-
80
-
81
-
82
-
83
-
84
-
85
-
86
-
87
-
88
-
89
-
90
-
91
-
92
-
93
-
94
-
95
-
96
-
97
-
98
-
99
-
100
-
101
-
 102
102 -
 103
103 -
 104
104 -
 105
105 -
 106
106 -
 107
107 -
 108
108 -
 109
109 -
 110
110 -
 111
111 -
 112
112 -
 113
113 -
 114
114 -
 115
115 -
 116
116 -
 117
117 -
 118
118 -
 119
119 -
 120
120 -
 121
121 -
 122
122 -
123
-
124
-
125
-
126
-
127
-
128
-
129
-
130
-
131
-
132
-
133
-
134
-
135
-
136
-
137
-
138
-
139
-
140
-
141
-
142
-
143
-
144
-
145
-
146
-
147
-
148
-
149
-
150
-
151
-
152
-
153
-
154
-
155
-
156
-
157
-
158
-
159
-
160
-
161
-
162
-
163
-
164
 |
 |
104
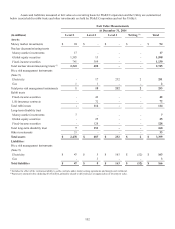
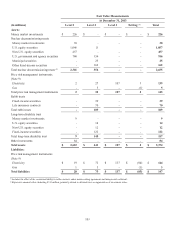
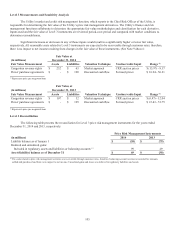
Valuation Techniques
The following describes the valuation techniques used to measure the fair value of the assets and liabilities shown in
the tables above. Investments, primarily consisting of equity securities, that are valued using a net asset value per share can be
redeemed quarterly with notice not to exceed 90 days. Equity investments valued at net asset value per share utilize investment
strategies aimed at matching the performance of indexed funds. Transfers between levels in the fair value hierarchy are recognized
as of the end of the reporting period. There were no material transfers between any levels for the year ended December 31, 2014
and 2013.
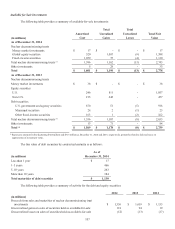
Trust Assets
Nuclear decommissioning trust assets and other trust assets are composed primarily of equity securities, debt securities,
and life insurance policies. In general, investments held in the trusts are exposed to various risks, such as interest rate, credit, and
market volatility risks.
Global equity securities primarily include investments in common stock that are valued based on quoted prices in active
markets and are classified as Level 1. Equity securities also include commingled funds that are composed of equity securities
traded publicly on exchanges across multiple industry sectors in the U.S. and other regions of the world. Investments in these funds
are classified as Level 2 because price quotes are readily observable and available.
Debt securities are primarily composed of U.S. government and agency securities, municipal securities, and other fixed-
income securities, including corporate debt securities. U.S. government and agency securities primarily consist of U.S. Treasury
securities that are classified as Level 1 because the fair value is determined by observable market prices in active markets. A
market approach is generally used to estimate the fair value of debt securities classified as Level 2 using evaluated pricing data
such as broker quotes, for similar securities adjusted for observable differences. Significant inputs used in the valuation model
generally include benchmark yield curves and issuer spreads. The external credit ratings, coupon rate, and maturity of each security
are considered in the valuation model, as applicable.
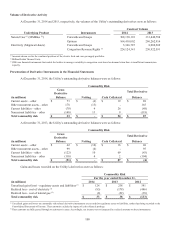
Price Risk Management Instruments
Price risk management instruments include physical and financial derivative contracts, such as power purchase
agreements, forwards, swaps, options, and CRRs that are traded either on an exchange or over-the-counter.
Power purchase agreements, forwards, and swaps are valued using a discounted cash flow model. Exchange-traded
forwards and swaps that are valued using observable market forward prices for the underlying commodity are classified as Level 1.
Over-the-counter forwards and swaps that are identical to exchange-traded forwards and swaps, or are valued using forward prices
from broker quotes that are corroborated with market data are classified as Level 2. Exchange-traded options are valued using
observable market data and market-corroborated data and are classified as Level 2.
Long-dated power purchase agreements that are valued using significant unobservable data are classified as Level 3.
These Level 3 contracts are valued using either estimated basis adjustments from liquid trading points or techniques, including
extrapolation from observable prices, when a contract term extends beyond a period for which market data is available. Market and
credit risk management utilizes models to derive pricing inputs for the valuation of the Utility’s Level 3 instruments using pricing
inputs from brokers and historical data.
The Utility holds CRRs to hedge the financial risk of CAISO-imposed congestion charges in the day-ahead market. CRRs
are classified as Level 3 and are valued based on CRR auction prices, including historical prices. Limited market data is available
in the CAISO auction and between auction dates; therefore, the Utility uses models to forecast CRR prices for those periods not
covered in the auctions.