PG&E 2014 Annual Report Download - page 113
Download and view the complete annual report
Please find page 113 of the 2014 PG&E annual report below. You can navigate through the pages in the report by either clicking on the pages listed below, or by using the keyword search tool below to find specific information within the annual report.-
 1
1 -
2
-
3
-
4
-
5
-
6
-
7
-
8
-
9
-
10
-
11
-
12
-
13
-
14
-
15
-
16
-
17
-
18
-
19
-
20
-
21
-
22
-
23
-
24
-
25
-
26
-
27
-
28
-
29
-
30
-
31
-
32
-
33
-
34
-
35
-
36
-
37
-
38
-
39
-
40
-
41
-
42
-
43
-
44
-
45
-
46
-
47
-
48
-
49
-
50
-
51
-
52
-
53
-
54
-
55
-
56
-
57
-
58
-
59
-
60
-
61
-
62
-
63
-
64
-
65
-
66
-
67
-
68
-
69
-
70
-
71
-
72
-
73
-
74
-
75
-
76
-
77
-
78
-
79
-
80
-
81
-
82
-
83
-
84
-
85
-
86
-
87
-
88
-
89
-
90
-
91
-
92
-
93
-
94
-
95
-
96
-
97
-
98
-
99
-
100
-
101
-
102
-
 103
103 -
 104
104 -
 105
105 -
 106
106 -
 107
107 -
 108
108 -
 109
109 -
 110
110 -
 111
111 -
 112
112 -
 113
113 -
 114
114 -
 115
115 -
 116
116 -
 117
117 -
 118
118 -
 119
119 -
 120
120 -
 121
121 -
 122
122 -
 123
123 -
124
-
125
-
126
-
127
-
128
-
129
-
130
-
131
-
132
-
133
-
134
-
135
-
136
-
137
-
138
-
139
-
140
-
141
-
142
-
143
-
144
-
145
-
146
-
147
-
148
-
149
-
150
-
151
-
152
-
153
-
154
-
155
-
156
-
157
-
158
-
159
-
160
-
161
-
162
-
163
-
164
 |
 |

105
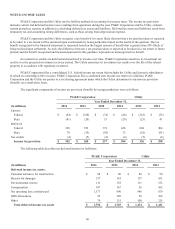
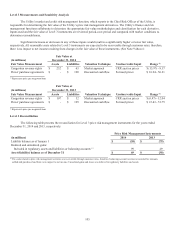
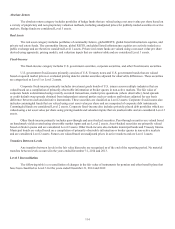
Level 3 Measurements and Sensitivity Analysis
The Utility’s market and credit risk management function, which reports to the Chief Risk Officer of the Utility, is
responsible for determining the fair value of the Utility’s price risk management derivatives. The Utility’s finance and risk
management functions collaborate to determine the appropriate fair value methodologies and classification for each derivative.
Inputs used and the fair value of Level 3 instruments are reviewed period-over-period and compared with market conditions to
determine reasonableness.
Significant increases or decreases in any of those inputs would result in a significantly higher or lower fair value,
respectively. All reasonable costs related to Level 3 instruments are expected to be recoverable through customer rates; therefore,
there is no impact to net income resulting from changes in the fair value of these instruments. (See Note 9 above.)
Fair Value at
(in millions) December 31, 2014
Fair Value Measurement Assets Liabilities Valuation Technique Unobservable Input Range (1)
Congestion revenue rights $ 232 $ 63 Market approach CRR auction prices $ (15.97) - 8.17
Power purchase agreements $ - $ 100 Discounted cash ow Forward prices $ 16.04 - 56.21
(1) Represents price per megawatt-hour
Fair Value at
(in millions) December 31, 2013
Fair Value Measurement Assets Liabilities Valuation Technique Unobservable Input Range (1)
Congestion revenue rights $ 107 $ 32 Market approach CRR auction prices $ (6.47) - 12.04
Power purchase agreements $ - $ 105 Discounted cash ow Forward prices $ 23.43 - 51.75
(1) Represents price per megawatt-hour
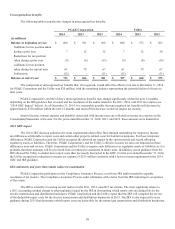
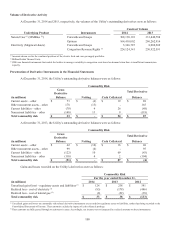
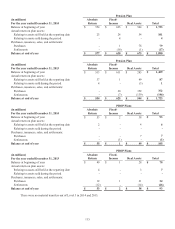
Level 3 Reconciliation
The following table presents the reconciliation for Level 3 price risk management instruments for the years ended
December 31, 2014 and 2013, respectively:
Price Risk Management Instruments
(in millions) 2014 2013
Liability balance as of January 1 $ (30) $ (79)
Realized and unrealized gains:
Included in regulatory assets and liabilities or balancing accounts (1) 99 49
Asset (liability) balance as of December 31 $ 69 $ (30)
(1) The costs related to price risk management activities are recoverable through customer rates, therefore, balancing account revenue is recorded for amounts
settled and purchased and there is no impact to net income. Unrealized gains and losses are deferred in regulatory liabilities and assets.