PG&E 2014 Annual Report Download - page 29
Download and view the complete annual report
Please find page 29 of the 2014 PG&E annual report below. You can navigate through the pages in the report by either clicking on the pages listed below, or by using the keyword search tool below to find specific information within the annual report.-
 1
1 -
2
-
3
-
4
-
5
-
6
-
7
-
8
-
9
-
10
-
11
-
12
-
13
-
14
-
15
-
16
-
17
-
18
-
 19
19 -
 20
20 -
 21
21 -
 22
22 -
 23
23 -
 24
24 -
 25
25 -
 26
26 -
 27
27 -
 28
28 -
 29
29 -
 30
30 -
 31
31 -
 32
32 -
 33
33 -
 34
34 -
 35
35 -
 36
36 -
 37
37 -
 38
38 -
 39
39 -
40
-
41
-
42
-
43
-
44
-
45
-
46
-
47
-
48
-
49
-
50
-
51
-
52
-
53
-
54
-
55
-
56
-
57
-
58
-
59
-
60
-
61
-
62
-
63
-
64
-
65
-
66
-
67
-
68
-
69
-
70
-
71
-
72
-
73
-
74
-
75
-
76
-
77
-
78
-
79
-
80
-
81
-
82
-
83
-
84
-
85
-
86
-
87
-
88
-
89
-
90
-
91
-
92
-
93
-
94
-
95
-
96
-
97
-
98
-
99
-
100
-
101
-
102
-
103
-
104
-
105
-
106
-
107
-
108
-
109
-
110
-
111
-
112
-
113
-
114
-
115
-
116
-
117
-
118
-
119
-
120
-
121
-
122
-
123
-
124
-
125
-
126
-
127
-
128
-
129
-
130
-
131
-
132
-
133
-
134
-
135
-
136
-
137
-
138
-
139
-
140
-
141
-
142
-
143
-
144
-
145
-
146
-
147
-
148
-
149
-
150
-
151
-
152
-
153
-
154
-
155
-
156
-
157
-
158
-
159
-
160
-
161
-
162
-
163
-
164
 |
 |

21
With respect to natural gas operations, both safety-related pipeline strength testing and normal pipeline maintenance
and operations release the GHG methane into the atmosphere. The Utility has taken steps to reduce the release of methane by
implementing techniques including drafting and cross-compression, which reduce the pressure and volume of natural gas within
pipelines prior to venting. In addition, the Utility continues to replace a substantial portion of its older cast iron, steel and plastic
distribution pipelines and steel gas transmission mains with new pipe, which reduces leakage.
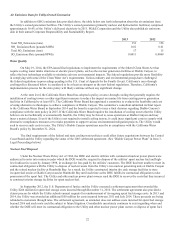
Emissions Data
PG&E Corporation and the Utility track and report their annual environmental performance results across a broad
spectrum of areas. The Utility reports its GHG emissions to the CARB and the EPA on a mandatory basis. On a voluntary basis, the
Utility reports a more comprehensive emissions inventory to The Climate Registry, a non-profit organization. The Utility’s third-
party verified voluntary GHG inventory reported to The Climate Registry for 2013 totaled more than 57 million metric tonnes
of CO2-e, two-thirds of which came from natural gas use. The following table shows the 2013 GHG emissions data the Utility
reported to the CARB under AB 32. PG&E Corporation and the Utility publish additional GHG emissions data in their annual
Corporate Responsibility and Sustainability Report.
SourceAmount (metric tonnes CO2 – equivalent)
Fossil Fuel-Fired Plants (1) 2,382,463
Natural Gas Compressor Stations (2) 325,701
Distribution Fugitive Natural Gas Emissions 213,858
Customer Natural Gas Use (3) 43,506,493
(1) Includes nitrous oxide and methane emissions from the Utility’s generating stations.
(2) Includes compressor stations emitting more than 25,000 metric tonnes of CO2-e annually.
(3) Includes emissions from the combustion of natural gas delivered to all entities on the Utility’s distribution system, including entities that have their own
compliance obligation under AB 32. The Utility’s compliance obligation under AB 32 (discussed above under “State Regulation”) applies to the combustion of
natural gas delivered to customers other than customers that have their own compliance obligation. Excluding the GHG emissions of entities that have their own
compliance obligation, the Utility’s GHG emissions for 2013 were approximately 19 million metric tonnes, as calculated by the CARB.
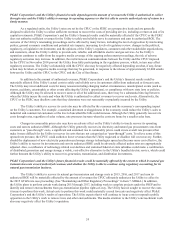
The following table shows the Utility’s third-party-verified CO2 emissions rate associated with the electricity delivered to
customers in 2013 as compared to the national and California averages for electric utilities:
Amount (Pounds of CO2 per MWh)
U.S. Average (1) 1,232
California’s Average (1) 611
Pacic Gas and Electric Company (2) 427
(1) Source: EPA eGRID.
(2) Since the Utility purchases a portion of its electricity from the wholesale market, the Utility is not able to track some of its delivered electricity back to a specific
generator. Therefore, there is some unavoidable uncertainty in the Utility’s emissions rate.