PG&E 2014 Annual Report Download - page 50
Download and view the complete annual report
Please find page 50 of the 2014 PG&E annual report below. You can navigate through the pages in the report by either clicking on the pages listed below, or by using the keyword search tool below to find specific information within the annual report.-
 1
1 -
2
-
3
-
4
-
5
-
6
-
7
-
8
-
9
-
10
-
11
-
12
-
13
-
14
-
15
-
16
-
17
-
18
-
19
-
20
-
21
-
22
-
23
-
24
-
25
-
26
-
27
-
28
-
29
-
30
-
31
-
32
-
33
-
34
-
35
-
36
-
37
-
38
-
39
-
 40
40 -
 41
41 -
 42
42 -
 43
43 -
 44
44 -
 45
45 -
 46
46 -
 47
47 -
 48
48 -
 49
49 -
 50
50 -
 51
51 -
 52
52 -
 53
53 -
 54
54 -
 55
55 -
 56
56 -
 57
57 -
 58
58 -
 59
59 -
 60
60 -
61
-
62
-
63
-
64
-
65
-
66
-
67
-
68
-
69
-
70
-
71
-
72
-
73
-
74
-
75
-
76
-
77
-
78
-
79
-
80
-
81
-
82
-
83
-
84
-
85
-
86
-
87
-
88
-
89
-
90
-
91
-
92
-
93
-
94
-
95
-
96
-
97
-
98
-
99
-
100
-
101
-
102
-
103
-
104
-
105
-
106
-
107
-
108
-
109
-
110
-
111
-
112
-
113
-
114
-
115
-
116
-
117
-
118
-
119
-
120
-
121
-
122
-
123
-
124
-
125
-
126
-
127
-
128
-
129
-
130
-
131
-
132
-
133
-
134
-
135
-
136
-
137
-
138
-
139
-
140
-
141
-
142
-
143
-
144
-
145
-
146
-
147
-
148
-
149
-
150
-
151
-
152
-
153
-
154
-
155
-
156
-
157
-
158
-
159
-
160
-
161
-
162
-
163
-
164
 |
 |

42
RESULTS OF OPERATIONS
The following discussion presents PG&E Corporation’s and the Utility’s operating results for 2014, 2013, and 2012. See
“Key Factors Affecting Results of Operations, Financial Condition, and Cash Flows” above for further discussion about factors
that could affect future results of operations.
PG&E Corporation
The consolidated results of operations consist primarily of results related to the Utility, which are discussed in the
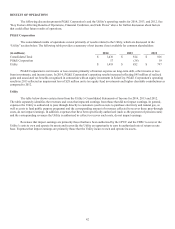
“Utility” section below. The following table provides a summary of net income (loss) available for common shareholders:
(in millions)2014 2013 2012
Consolidated Total $1,436 $814 $816
PG&E Corporation 17 (38) 19
Utility $ 1,419 $852 $797
PG&E Corporation’s net income or loss consists primarily of interest expense on long-term debt, other income or loss
from investments, and income taxes. In 2014, PG&E Corporation’s operating results increased reflecting $45 million of realized
gains and associated tax benefits recognized in connection with an equity investment in SolarCity. PG&E Corporation’s operating
results in 2013 reflected an impairment loss of $28 million on its tax equity fund investments and higher charitable contributions as
compared to 2012.
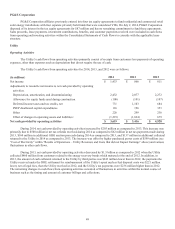
Utility
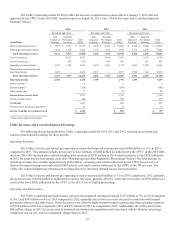
The table below shows certain items from the Utility’s Consolidated Statements of Income for 2014, 2013 and 2012.
The table separately identifies the revenues and costs that impacted earnings from those that did not impact earnings. In general,
expenses the Utility is authorized to pass through directly to customers (such as costs to purchase electricity and natural gas, as
well as costs to fund public purpose programs) and the corresponding amount of revenues collected to recover those pass-through
costs, do not impact earnings. In addition, expenses that have been specifically authorized (such as the payment of pension costs)
and the corresponding revenues the Utility is authorized to collect to recover such costs, do not impact earnings.
Revenues that impact earnings are primarily those that have been authorized by the CPUC and the FERC to recover the
Utility’s costs to own and operate its assets and to provide the Utility an opportunity to earn its authorized rate of return on rate
base. Expenses that impact earnings are primarily those that the Utility incurs to own and operate its assets.