PG&E 2014 Annual Report Download - page 121
Download and view the complete annual report
Please find page 121 of the 2014 PG&E annual report below. You can navigate through the pages in the report by either clicking on the pages listed below, or by using the keyword search tool below to find specific information within the annual report.-
 1
1 -
2
-
3
-
4
-
5
-
6
-
7
-
8
-
9
-
10
-
11
-
12
-
13
-
14
-
15
-
16
-
17
-
18
-
19
-
20
-
21
-
22
-
23
-
24
-
25
-
26
-
27
-
28
-
29
-
30
-
31
-
32
-
33
-
34
-
35
-
36
-
37
-
38
-
39
-
40
-
41
-
42
-
43
-
44
-
45
-
46
-
47
-
48
-
49
-
50
-
51
-
52
-
53
-
54
-
55
-
56
-
57
-
58
-
59
-
60
-
61
-
62
-
63
-
64
-
65
-
66
-
67
-
68
-
69
-
70
-
71
-
72
-
73
-
74
-
75
-
76
-
77
-
78
-
79
-
80
-
81
-
82
-
83
-
84
-
85
-
86
-
87
-
88
-
89
-
90
-
91
-
92
-
93
-
94
-
95
-
96
-
97
-
98
-
99
-
100
-
101
-
102
-
103
-
104
-
105
-
106
-
107
-
108
-
109
-
110
-
 111
111 -
 112
112 -
 113
113 -
 114
114 -
 115
115 -
 116
116 -
 117
117 -
 118
118 -
 119
119 -
 120
120 -
 121
121 -
 122
122 -
 123
123 -
 124
124 -
 125
125 -
 126
126 -
 127
127 -
 128
128 -
 129
129 -
 130
130 -
 131
131 -
132
-
133
-
134
-
135
-
136
-
137
-
138
-
139
-
140
-
141
-
142
-
143
-
144
-
145
-
146
-
147
-
148
-
149
-
150
-
151
-
152
-
153
-
154
-
155
-
156
-
157
-
158
-
159
-
160
-
161
-
162
-
163
-
164
 |
 |

113
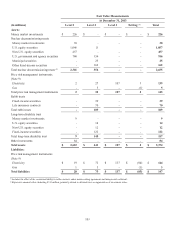
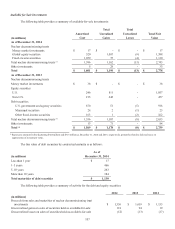
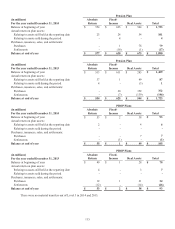
Fair Value Measurements
The following tables present the fair value of plan assets for pension and other benefits plans by major asset category at
December 31, 2014 and 2013.
Fair Value Measurements
At December 31,
2014 2013
(in millions) Level 1 Level 2 Level 3 Total Level 1 Level 2 Level 3 Total
Pension Plan:
Short-term investments $ 352 $ 311 $ - $ 663 $ 70 $ - $ - $ 70
Global equity 918 2,311 - 3,229 1,123 2,363 - 3,486
Absolute return - - 577 577 - - 554 554
Real assets 620 - 675 1,295 562 - 544 1,106
Fixed-income 2,068 5,718 638 8,424 1,448 5,104 625 7,177
Total $ 3,958 $ 8,340 $ 1,890 $ 14,188 $ 3,203 $ 7,467 $ 1,723 $ 12,393
PBOP Plans:
Short-term investments $ 28 $ - $ - $ 28 $ 31 $ - $ - $ 31
Global equity 124 549 - 673 127 504 - 631
Absolute return - - 55 55 - - 53 53
Real assets 72 - 49 121 67 - 38 105
Fixed-income 163 1,055 1 1,219 137 936 2 1,075
Total $ 387 $ 1,604 $ 105 $ 2,096 $ 362 $ 1,440 $ 93 $ 1,895
Total plan assets at fair value $ 16,284 $ 14,288
In addition to the total plan assets disclosed at fair value in the table above, the trusts had other net assets of $24 million
and $131 million at December 31, 2014 and 2013, respectively. These net assets and net liabilities were comprised primarily of
cash, accounts receivable, accounts payable, and deferred taxes.
Valuation Techniques
The following describes the valuation techniques used to measure the fair value of the assets and liabilities shown in the
table above. All investments that are valued using a net asset value per share can be redeemed quarterly with a notice not to exceed
90 days.
Short-Term Investments
Historically, short-term investments consisted primarily of commingled funds of U.S. government short-term securities
that were considered Level 1 assets and valued at the net asset value of $1 per unit.
In 2014, PG&E began diversifying these short-term investments across government, credit, and asset-backed sectors.
These securities are categorized as Level 1 and Level 2 assets.
Global Equity
The global equity category includes investments in common stock, equity-index futures, and commingled funds
comprised of equity securities spread across multiple industries and regions of the world. Equity investments in common stock are
actively traded on public exchanges and are therefore considered Level 1 assets. These equity investments are generally valued
based on unadjusted prices in active markets for identical securities. Equity-index futures are valued based on unadjusted prices
in active markets and are Level 1 assets. Commingled funds are valued using a net asset value per share and are maintained by
investment companies for large institutional investors and are not publicly traded. Commingled funds are comprised primarily of
underlying equity securities that are publicly traded on exchanges, and price quotes for the assets held by these funds are readily
observable and available. Commingled funds are categorized as Level 1 and Level 2 assets.