PG&E 2014 Annual Report Download - page 156
Download and view the complete annual report
Please find page 156 of the 2014 PG&E annual report below. You can navigate through the pages in the report by either clicking on the pages listed below, or by using the keyword search tool below to find specific information within the annual report.-
 1
1 -
2
-
3
-
4
-
5
-
6
-
7
-
8
-
9
-
10
-
11
-
12
-
13
-
14
-
15
-
16
-
17
-
18
-
19
-
20
-
21
-
22
-
23
-
24
-
25
-
26
-
27
-
28
-
29
-
30
-
31
-
32
-
33
-
34
-
35
-
36
-
37
-
38
-
39
-
40
-
41
-
42
-
43
-
44
-
45
-
46
-
47
-
48
-
49
-
50
-
51
-
52
-
53
-
54
-
55
-
56
-
57
-
58
-
59
-
60
-
61
-
62
-
63
-
64
-
65
-
66
-
67
-
68
-
69
-
70
-
71
-
72
-
73
-
74
-
75
-
76
-
77
-
78
-
79
-
80
-
81
-
82
-
83
-
84
-
85
-
86
-
87
-
88
-
89
-
90
-
91
-
92
-
93
-
94
-
95
-
96
-
97
-
98
-
99
-
100
-
101
-
102
-
103
-
104
-
105
-
106
-
107
-
108
-
109
-
110
-
111
-
112
-
113
-
114
-
115
-
116
-
117
-
118
-
119
-
120
-
121
-
122
-
123
-
124
-
125
-
126
-
127
-
128
-
129
-
130
-
131
-
132
-
133
-
134
-
135
-
136
-
137
-
138
-
139
-
140
-
141
-
142
-
143
-
144
-
145
-
 146
146 -
 147
147 -
 148
148 -
 149
149 -
 150
150 -
 151
151 -
 152
152 -
 153
153 -
 154
154 -
 155
155 -
 156
156 -
 157
157 -
 158
158 -
 159
159 -
 160
160 -
 161
161 -
 162
162 -
 163
163 -
 164
164
 |
 |

148
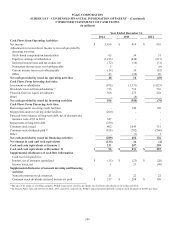
PG&E CORPORATION
SCHEDULE I — CONDENSED FINANCIAL INFORMATION OF PARENT – (Continued)
CONDENSED BALANCE SHEETS
Balance at December 31,
(in millions) 2014 2013
ASSETS
Current Assets
Cash and cash equivalents $ 96 $ 231
Advances to afliates 31 30
Income taxes receivable 29 13
Other 38 86
Total current assets 194 360
Noncurrent Assets
Equipment 2 2
Accumulated depreciation (1) (1)
Net equipment 1 1
Investments in subsidiaries 16,003 14,711
Other investments 117 110
Income taxes receivable - 5
Deferred income taxes 260 188
Total noncurrent assets 16,381 15,015
Total Assets $ 16,575 $ 15,375
LIABILITIES AND SHAREHOLDERS’ EQUITY
Current Liabilities
Short-term borrowings $ - $ 260
Long-term debt classied as current - 350
Accounts payable – other 67 66
Other 269 230
Total current liabilities 336 906
Noncurrent Liabilities
Long-term debt 350 -
Other 141 127
Total noncurrent liabilities 491 127
Common Shareholders’ Equity
Common stock 10,421 9,550
Reinvested earnings 5,316 4,742
Accumulated other comprehensive loss 11 50
Total common shareholders’ equity 15,748 14,342
Total Liabilities and Shareholders’ Equity $ 16,575 $ 15,375