PG&E 2009 Annual Report Download - page 98
Download and view the complete annual report
Please find page 98 of the 2009 PG&E annual report below. You can navigate through the pages in the report by either clicking on the pages listed below, or by using the keyword search tool below to find specific information within the annual report.-
 1
1 -
2
-
3
-
4
-
5
-
6
-
7
-
8
-
9
-
10
-
11
-
12
-
13
-
14
-
15
-
16
-
17
-
18
-
19
-
20
-
21
-
22
-
23
-
24
-
25
-
26
-
27
-
28
-
29
-
30
-
31
-
32
-
33
-
34
-
35
-
36
-
37
-
38
-
39
-
40
-
41
-
42
-
43
-
44
-
45
-
46
-
47
-
48
-
49
-
50
-
51
-
52
-
53
-
54
-
55
-
56
-
57
-
58
-
59
-
60
-
61
-
62
-
63
-
64
-
65
-
66
-
67
-
68
-
69
-
70
-
71
-
72
-
73
-
74
-
75
-
76
-
77
-
78
-
79
-
80
-
81
-
82
-
83
-
84
-
85
-
86
-
87
-
 88
88 -
 89
89 -
 90
90 -
 91
91 -
 92
92 -
 93
93 -
 94
94 -
 95
95 -
 96
96 -
 97
97 -
 98
98 -
 99
99 -
 100
100 -
 101
101 -
 102
102 -
 103
103 -
 104
104 -
 105
105 -
 106
106 -
 107
107 -
 108
108 -
109
-
110
-
111
-
112
-
113
-
114
-
115
-
116
-
117
-
118
-
119
-
120
-
121
-
122
-
123
-
124
 |
 |

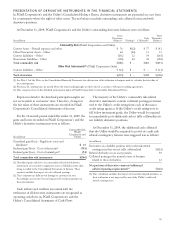
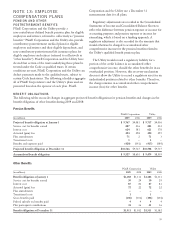
CHANGE IN PLAN ASSETS
The following tables reconcile aggregate changes in plan assets during 2009 and 2008:
Pension Benefits
PG&E Corporation Utility
(in millions) 2009 2008 2009 2008
Fair value of plan assets at January 1 $8,066 $ 9,540 $8,066 $ 9,540
Actual return on plan assets 1,523 (1,232) 1,523 (1,232)
Company contributions 187 182 184 179
Benefits and expenses paid (446) (424) (443) (421)
Fair value of plan assets at December 31 $9,330 $ 8,066 $9,330 $ 8,066
Other Benefits
PG&E Corporation Utility
(in millions) 2009 2008 2009 2008
Fair value of plan assets at January 1 $ 990 $1,331 $ 990 $1,331
Actual return on plan assets 166 (316) 166 (316)
Company contributions 87 48 87 48
Plan participant contribution 42 36 42 36
Benefits and expenses paid (116) (109) (116) (109)
Fair value of plan assets at December 31 $1,169 $ 990 $1,169 $ 990
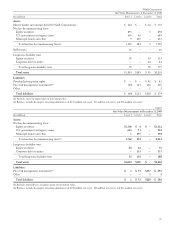
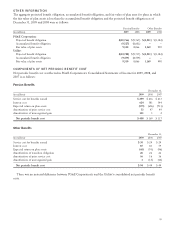
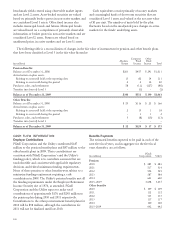
FUNDED STATUS
The following schedule shows the plans’ aggregate funded status on a plan sponsor basis. The funded status is the
difference between the fair value of plan assets and projected benefit obligations.
Pension Benefits
PG&E Corporation Utility
December 31, December 31,
(in millions) 2009 2008 2009 2008
Fair value of plan assets at December 31 $ 9,330 $ 8,066 $ 9,330 $ 8,066
Projected benefit obligation at December 31 (10,766) (9,767) (10,708) (9,717)
Prepaid/(accrued) benefit cost $ (1,436) $(1,701) $ (1,378) $(1,651)
Noncurrent asset $—$—$—$—
Current liability (5) (5) (3) (3)
Noncurrent liability (1,431) (1,696) (1,375) (1,648)
Prepaid/(accrued) benefit cost $ (1,436) $(1,701) $ (1,378) $(1,651)
Other Benefits
PG&E Corporation Utility
December 31, December 31,
(in millions) 2009 2008 2009 2008
Fair value of plan assets at December 31 $ 1,169 $ 990 $ 1,169 $ 990
Benefit obligation at December 31 (1,511) (1,382) (1,511) (1,382)
Prepaid/(accrued) benefit cost $ (342) $ (392) $ (342) $ (392)
Noncurrent asset $—$—$—$—
Noncurrent liability (342) (392) (342) (392)
Prepaid/(accrued) benefit cost $ (342) $ (392) $ (342) $ (392)
94