PG&E 2009 Annual Report Download - page 94
Download and view the complete annual report
Please find page 94 of the 2009 PG&E annual report below. You can navigate through the pages in the report by either clicking on the pages listed below, or by using the keyword search tool below to find specific information within the annual report.-
 1
1 -
2
-
3
-
4
-
5
-
6
-
7
-
8
-
9
-
10
-
11
-
12
-
13
-
14
-
15
-
16
-
17
-
18
-
19
-
20
-
21
-
22
-
23
-
24
-
25
-
26
-
27
-
28
-
29
-
30
-
31
-
32
-
33
-
34
-
35
-
36
-
37
-
38
-
39
-
40
-
41
-
42
-
43
-
44
-
45
-
46
-
47
-
48
-
49
-
50
-
51
-
52
-
53
-
54
-
55
-
56
-
57
-
58
-
59
-
60
-
61
-
62
-
63
-
64
-
65
-
66
-
67
-
68
-
69
-
70
-
71
-
72
-
73
-
74
-
75
-
76
-
77
-
78
-
79
-
80
-
81
-
82
-
83
-
 84
84 -
 85
85 -
 86
86 -
 87
87 -
 88
88 -
 89
89 -
 90
90 -
 91
91 -
 92
92 -
 93
93 -
 94
94 -
 95
95 -
 96
96 -
 97
97 -
 98
98 -
 99
99 -
 100
100 -
 101
101 -
 102
102 -
 103
103 -
 104
104 -
105
-
106
-
107
-
108
-
109
-
110
-
111
-
112
-
113
-
114
-
115
-
116
-
117
-
118
-
119
-
120
-
121
-
122
-
123
-
124
 |
 |

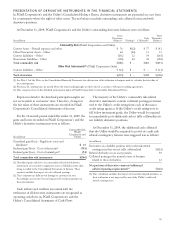
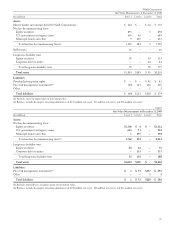
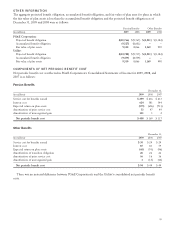
The carrying amount and fair value of PG&E Corporation’s and the Utility’s financial instruments were as follows (the
table below excludes financial instruments with carrying values that approximate their fair values):
At December 31,
2009 2008
(in millions) Carrying
Amount Fair
Value Carrying
Amount Fair
Value
Debt (Note 4):
PG&E Corporation $ 597 $1,096 $ 280 $ 739
Utility 9,240 9,824 8,740 9,134
Energy recovery bonds (Note 5) 1,213 1,269 1,583 1,564
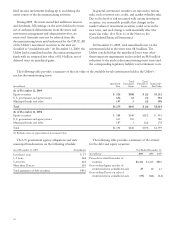
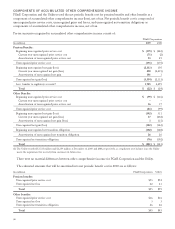
LEVEL 3 ROLLFORWARD
The following table is a reconciliation of changes in fair value of PG&E Corporation’s instruments that have been
classified as Level 3 in the fair value hierarchy for the years ended 2009 and 2008:
PG&E Corporation
Only PG&E Corporation and the Utility
(in millions) Money
Market
Dividend
Participation
Rights
Price Risk
Management
Instruments
Nuclear
Decommissioning
Trusts Equity
Securities(1)
Long-
Term
Disability
Equity
Securities
Long-
Term
Disability
Corp.
Debt
Securities Other Total
Asset (Liability) Balance as of January 1,
2008 $ — $(68) $ 115 $ 8 $ 61 $ 26 $(4) $ 138
Realized and unrealized gains (losses):
Included in earnings — (3) — (35) 1 — (37)
Included in regulatory assets and
liabilities
or balancing accounts — — (271) (3) — — 2 (272)
Purchases, issuances, and settlements (50) 29 — — 28 (3) — 4
Transfers in to (out of) Level 3 62 — — — — — — 62
Asset (Liability) Balance as of
December 31, 2008 $ 12 $(42) $(156) $ 5 $ 54 $ 24 $(2) $(105)
Realized and unrealized gains (losses):
Included in earnings — 2 — 12 3 — 17
Included in regulatory assets and
liabilities or balancing accounts — — (61) 1 — — (1) (61)
Purchases, issuances, and settlements (8) 28 — — (43) 86 — 63
Transfers in to (out of) Level 3 — — — (6) (23) (113) — (142)
Asset (Liability) Balance as of
December 31, 2009 $ 4 $(12) $(217) $ — $ — $ — $(3) $(228)
(1) Excludes deferred taxes on appreciation of investment value.
Earnings for the period were impacted by a $17 million unrealized gain relating to assets or liabilities still held at
December 31, 2009.
PG&E Corporation and the Utility did not have any nonrecurring financial measurements as of December 31, 2009.
90