PG&E 2009 Annual Report Download - page 116
Download and view the complete annual report
Please find page 116 of the 2009 PG&E annual report below. You can navigate through the pages in the report by either clicking on the pages listed below, or by using the keyword search tool below to find specific information within the annual report.
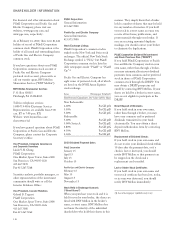
QUARTERLY CONSOLIDATED FINANCIAL DATA (UNAUDITED)
Quarter ended
(in millions, except per share amounts) December 31 September 30 June 30 March 31
2009
PG&E Corporation
Operating revenues $3,539 $3,235 $3,194 $3,431
Operating income 523 607 656 513
Income from continuing operations 277 321 392 244
Net income 277 321 392 244
Income available for common shareholders 273 318 388 241
Earnings per common share from continuing operations, basic 0.72 0.84 1.03 0.65
Earnings per common share from continuing operations, diluted 0.71 0.83 1.02 0.65
Net earnings per common share, basic 0.72 0.84 1.03 0.65
Net earnings per common share, diluted 0.71 0.83 1.02 0.65
Common stock price per share:
High 45.79 41.97 39.11 41.06
Low 39.74 36.59 34.60 34.50
Utility
Operating revenues $3,539 $3,235 $3,194 $3,431
Operating income 525 607 657 513
Net income 267 353 391 239
Income available for common shareholders 263 350 387 236
2008
PG&E Corporation
Operating revenues $3,643 $3,674 $3,578 $3,733
Operating income 545 639 584 493
Income from continuing operations 367 307 297 227
Net income 521 307 297 227
Income available for common shareholders 517 304 293 224
Earnings per common share from continuing operations, basic 0.98 0.83 0.80 0.62
Earnings per common share from continuing operations, diluted 0.97 0.83 0.80 0.62
Net earnings per common share, basic 1.39 0.83 0.80 0.62
Net earnings per common share, diluted 1.37 0.83 0.80 0.62
Common stock price per share:
High 39.20 42.64 40.90 44.95
Low 29.70 36.81 38.09 36.46
Utility
Operating revenues $3,643 $3,674 $3,578 $3,733
Operating income 548 640 585 493
Net income 329 321 313 236
Income available for common shareholders 325 318 309 233
112


