PG&E 2009 Annual Report Download - page 104
Download and view the complete annual report
Please find page 104 of the 2009 PG&E annual report below. You can navigate through the pages in the report by either clicking on the pages listed below, or by using the keyword search tool below to find specific information within the annual report.-
 1
1 -
2
-
3
-
4
-
5
-
6
-
7
-
8
-
9
-
10
-
11
-
12
-
13
-
14
-
15
-
16
-
17
-
18
-
19
-
20
-
21
-
22
-
23
-
24
-
25
-
26
-
27
-
28
-
29
-
30
-
31
-
32
-
33
-
34
-
35
-
36
-
37
-
38
-
39
-
40
-
41
-
42
-
43
-
44
-
45
-
46
-
47
-
48
-
49
-
50
-
51
-
52
-
53
-
54
-
55
-
56
-
57
-
58
-
59
-
60
-
61
-
62
-
63
-
64
-
65
-
66
-
67
-
68
-
69
-
70
-
71
-
72
-
73
-
74
-
75
-
76
-
77
-
78
-
79
-
80
-
81
-
82
-
83
-
84
-
85
-
86
-
87
-
88
-
89
-
90
-
91
-
92
-
93
-
 94
94 -
 95
95 -
 96
96 -
 97
97 -
 98
98 -
 99
99 -
 100
100 -
 101
101 -
 102
102 -
 103
103 -
 104
104 -
 105
105 -
 106
106 -
 107
107 -
 108
108 -
 109
109 -
 110
110 -
 111
111 -
 112
112 -
 113
113 -
 114
114 -
115
-
116
-
117
-
118
-
119
-
120
-
121
-
122
-
123
-
124
 |
 |

benchmark yields created using observable market inputs
and are Level 2 assets. Asset-backed securities are valued
based on primarily broker quotes in non-active markets and
are considered Level 3 assets. Other fixed income also
includes municipal bonds and futures. Municipal bonds
are valued based on a compilation of primarily observable
information or broker quotes in non-active markets and are
considered Level 2 assets. Futures are valued based on
unadjusted prices in active markets and are Level 1 assets.
Cash equivalents consist primarily of money markets
and commingled funds of short term securities that are
considered Level 1 assets and valued at the net asset value
of $1 per unit. The number of units held by the plan
fluctuates based on the unadjusted price changes in active
markets for the funds’ underlying assets.
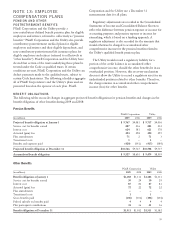
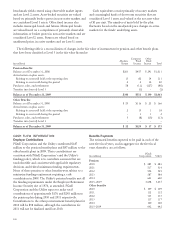
The following table is a reconciliation of changes in the fair value of instruments for pension and other benefit plans
that have been classified as Level 3 in the fair value hierarchy:
(in millions) Absolute
Return
Corporate
Fixed
Income
Other
Fixed
Income Total
Pension Benefits:
Balance as of December 31, 2008 $263 $457 $ 291 $1,011
Actual return on plan assets:
Relating to assets still held at the reporting date 15 82 14 111
Relating to assets sold during the period 4 4 12 20
Purchases, sales, and settlements 58 (11) (127) (80)
Transfers into (out of) Level 3 – (1) – (1)
Balance as of December 31, 2009 $340 $531 $ 190 $1,061
Other Benefits:
Balance as of December 31, 2008 $ 25 $116 $ 25 $ 166
Actual return on plan assets:
Relating to assets still held at the reporting date 2 15 1 18
Relating to assets sold during the period – 1 1 2
Purchases, sales, and settlements 5 (8) (10) (13)
Transfers into (out of) Level 3 – – – –
Balance as of December 31, 2009 $ 32 $124 $ 17 $ 173
CASH FLOW INFORMATION
Employer Contributions
PG&E Corporation and the Utility contributed $187
million to the pension benefit plans and $87 million to the
other benefit plans in 2009. These contributions are
consistent with PG&E Corporation’s and the Utility’s
funding policy, which is to contribute amounts that are
tax-deductible and consistent with applicable regulatory
decisions and federal minimum funding requirements.
None of these pension or other benefits were subject to a
minimum funding requirement requiring a cash
contribution in 2009. The Utility’s pension benefits met all
the funding requirements under the Employee Retirement
Income Security Act of 1974, as amended. PG&E
Corporation and the Utility expect to make total
contributions of approximately $176 and $245 million to
the pension plan during 2010 and 2011 respectively.
Contributions to the other postretirement benefit plans for
2010 will be $58 million, although the contribution for
2011 will not be finalized until late 2010.
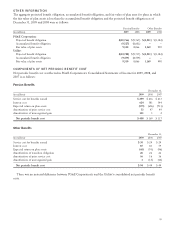
Benefits Payments
The estimated benefits expected to be paid in each of the
next five fiscal years, and in aggregate for the five fiscal
years thereafter, are as follows:
(in millions) PG&E
Corporation Utility
Pension
2010 $ 485 $ 483
2011 517 514
2012 552 549
2013 587 584
2014 623 620
2015—2019 3,658 3,637
Other benefits
2010 $ 109 $ 109
2011 112 112
2012 113 113
2013 117 117
2014 120 120
2015–2019 642 642
100