PG&E 2009 Annual Report Download - page 60
Download and view the complete annual report
Please find page 60 of the 2009 PG&E annual report below. You can navigate through the pages in the report by either clicking on the pages listed below, or by using the keyword search tool below to find specific information within the annual report.-
 1
1 -
2
-
3
-
4
-
5
-
6
-
7
-
8
-
9
-
10
-
11
-
12
-
13
-
14
-
15
-
16
-
17
-
18
-
19
-
20
-
21
-
22
-
23
-
24
-
25
-
26
-
27
-
28
-
29
-
30
-
31
-
32
-
33
-
34
-
35
-
36
-
37
-
38
-
39
-
40
-
41
-
42
-
43
-
44
-
45
-
46
-
47
-
48
-
49
-
 50
50 -
 51
51 -
 52
52 -
 53
53 -
 54
54 -
 55
55 -
 56
56 -
 57
57 -
 58
58 -
 59
59 -
 60
60 -
 61
61 -
 62
62 -
 63
63 -
 64
64 -
 65
65 -
 66
66 -
 67
67 -
 68
68 -
 69
69 -
 70
70 -
71
-
72
-
73
-
74
-
75
-
76
-
77
-
78
-
79
-
80
-
81
-
82
-
83
-
84
-
85
-
86
-
87
-
88
-
89
-
90
-
91
-
92
-
93
-
94
-
95
-
96
-
97
-
98
-
99
-
100
-
101
-
102
-
103
-
104
-
105
-
106
-
107
-
108
-
109
-
110
-
111
-
112
-
113
-
114
-
115
-
116
-
117
-
118
-
119
-
120
-
121
-
122
-
123
-
124
 |
 |

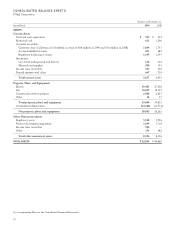
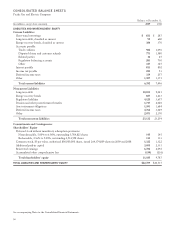
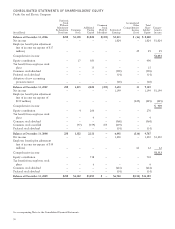
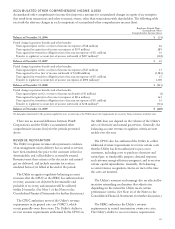
CONSOLIDATED BALANCE SHEETS
Pacific Gas and Electric Company
Balance at December 31,
(in millions, except share amounts) 2009 2008
LIABILITIES AND SHAREHOLDERS’ EQUITY
Current Liabilities
Short-term borrowings $ 833 $ 287
Long-term debt, classified as current 95 600
Energy recovery bonds, classified as current 386 370
Accounts payable:
Trade creditors 984 1,096
Disputed claims and customer refunds 773 1,580
Related parties 16 25
Regulatory balancing accounts 281 730
Other 347 325
Interest payable 813 802
Income tax payable 223 53
Deferred income taxes 334 257
Other 1,307 1,371
Total current liabilities 6,392 7,496
Noncurrent Liabilities
Long-term debt 10,033 9,041
Energy recovery bonds 827 1,213
Regulatory liabilities 4,125 3,657
Pension and other postretirement benefits 1,717 2,040
Asset retirement obligations 1,593 1,684
Deferred income taxes 4,764 3,449
Other 2,073 2,170
Total noncurrent liabilities 25,132 23,254
Commitments and Contingencies
Shareholders’ Equity
Preferred stock without mandatory redemption provisions:
Nonredeemable, 5.00% to 6.00%, outstanding 5,784,825 shares 145 145
Redeemable, 4.36% to 5.00%, outstanding 4,534,958 shares 113 113
Common stock, $5 par value, authorized 800,000,000 shares, issued 264,374,809 shares in 2009 and 2008 1,322 1,322
Additional paid-in capital 3,055 2,331
Reinvested earnings 6,704 6,092
Accumulated other comprehensive loss (154) (216)
Total shareholders’ equity 11,185 9,787
TOTAL LIABILITIES AND SHAREHOLDERS’ EQUITY $42,709 $40,537
See accompanying Notes to the Consolidated Financial Statements.
56