PG&E 2009 Annual Report Download - page 27
Download and view the complete annual report
Please find page 27 of the 2009 PG&E annual report below. You can navigate through the pages in the report by either clicking on the pages listed below, or by using the keyword search tool below to find specific information within the annual report.-
 1
1 -
2
-
3
-
4
-
5
-
6
-
7
-
8
-
9
-
10
-
11
-
12
-
13
-
14
-
15
-
16
-
 17
17 -
 18
18 -
 19
19 -
 20
20 -
 21
21 -
 22
22 -
 23
23 -
 24
24 -
 25
25 -
 26
26 -
 27
27 -
 28
28 -
 29
29 -
 30
30 -
 31
31 -
 32
32 -
 33
33 -
 34
34 -
 35
35 -
 36
36 -
 37
37 -
38
-
39
-
40
-
41
-
42
-
43
-
44
-
45
-
46
-
47
-
48
-
49
-
50
-
51
-
52
-
53
-
54
-
55
-
56
-
57
-
58
-
59
-
60
-
61
-
62
-
63
-
64
-
65
-
66
-
67
-
68
-
69
-
70
-
71
-
72
-
73
-
74
-
75
-
76
-
77
-
78
-
79
-
80
-
81
-
82
-
83
-
84
-
85
-
86
-
87
-
88
-
89
-
90
-
91
-
92
-
93
-
94
-
95
-
96
-
97
-
98
-
99
-
100
-
101
-
102
-
103
-
104
-
105
-
106
-
107
-
108
-
109
-
110
-
111
-
112
-
113
-
114
-
115
-
116
-
117
-
118
-
119
-
120
-
121
-
122
-
123
-
124
 |
 |

During 2009, the Utility paid cash dividends to holders
of its outstanding series of preferred stock totaling $14
million. On December 16, 2009, the Board of Directors of
the Utility declared a cash dividend on its outstanding
series of preferred stock totaling $4 million that was paid
on February 15, 2010 to preferred shareholders of record
on January 29, 2010. On February 17, 2010, the Board of
Directors of the Utility declared a cash dividend on its
outstanding series of preferred stock, payable on May 15,
2010, to shareholders of record on April 30, 2010.
UTILITY
Operating Activities
The Utility’s cash flows from operating activities primarily
consist of receipts from customers less payments of
operating expenses, other than expenses such as
depreciation that do not require the use of cash.
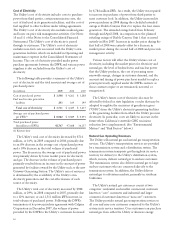
The Utility’s cash flows from operating activities for
2009, 2008, and 2007 were as follows:
(in millions) 2009 2008 2007
Net income $1,250 $1,199 $1,024
Adjustments to reconcile net income
to net cash provided by operating
activities:
Depreciation, amortization, and
decommissioning 1,927 1,838 1,956
Allowance for equity funds used
during construction (94) (70) (64)
Deferred income taxes and tax
credits, net 787 593 43
Other changes in noncurrent assets
and liabilities 6(25) 188
Effect of changes in operating assets
and liabilities:
Accounts receivable 157 (83) (6)
Inventories 109 (59) (41)
Accounts payable (33) (137) (196)
Disputed claims and customer
refunds (700) ––
Income taxes receivable/payable 21 43 56
Regulatory balancing accounts, net (521) (394) (567)
Other current assets (2) (223) 170
Other current liabilities 24 90 24
Other (27) (6) (46)
Net cash provided by
operating activities $2,904 $2,766 $2,541
During 2009, net cash provided by operating activities
increased $138 million compared to the same period in
2008, primarily due to the collection of $821 million in
rates to recover an under-collection in the Utility’s energy
resource recovery balancing account that was incurred in
2008 due to higher than expected energy procurement
costs. (See Note 3 of the Notes to the Consolidated
Financial Statements.) The increase in operating cash flows
also reflects a decline of $520 million in net collateral paid
by the Utility related to price risk management activities in
2009. Collateral payables and receivables are included in
Other changes in noncurrent assets and liabilities, Other
current assets, and Other current liabilities in the table
above. (See Note 10 of the Notes to the Consolidated
Financial Statements.) Operating cash flows in 2009 were
also favorably impacted by an increase of $75 million due
to the timing and amount of various tax settlements and
payments. (See Note 9 of the Notes to the Consolidated
Financial Statements for further discussion.)
Increases in operating cash flows in 2009 were partially
offset by a $700 million payment to the California Power
Exchange to reduce the Utility’s liability for the remaining
net disputed claims (see Note 14 of the Notes to the
Consolidated Financial Statements), a refund of $230
million received by the Utility in 2008 from the California
Energy Commission with no similar refund in 2009, and
the subsequent return of this $230 million refund to
customers in 2009 (see Note 3 of the Notes to the
Consolidated Financial Statements).
During 2008, net cash provided by operating activities
increased by $225 million compared to the same period in
2007, primarily due to an increase in net income tax
refunds received of $689 million and an increase of $230
million for a refund received by the Utility from the
California Energy Commission with no similar refund in
2007. These increases in operating cash flows were partially
offset by an increase of $459 million in net collateral paid
by the Utility related to price risk management activities in
2008 reflecting declining natural gas prices.
Various factors can affect the Utility’s future operating
cash flows, including the timing of cash collateral payments
and receipts related to price risk management activity. The
Utility’s cash collateral activity will fluctuate based on
changes in the Utility’s net credit exposure to
counterparties, which primarily depends on electricity and
gas price movement. The Utility’s operating cash flows also
will be impacted by electricity procurement costs and the
timing of rate adjustments authorized to recover these
costs. The CPUC has established a balancing account
mechanism to adjust the Utility’s electric rates whenever
the forecasted aggregate over-collections or under-
collections of the Utility’s electric procurement costs for
the current year exceed 5% of the Utility’s prior-year
generation revenues, excluding generation revenues for
DWR contracts.
23