PG&E 2009 Annual Report Download - page 81
Download and view the complete annual report
Please find page 81 of the 2009 PG&E annual report below. You can navigate through the pages in the report by either clicking on the pages listed below, or by using the keyword search tool below to find specific information within the annual report.-
 1
1 -
2
-
3
-
4
-
5
-
6
-
7
-
8
-
9
-
10
-
11
-
12
-
13
-
14
-
15
-
16
-
17
-
18
-
19
-
20
-
21
-
22
-
23
-
24
-
25
-
26
-
27
-
28
-
29
-
30
-
31
-
32
-
33
-
34
-
35
-
36
-
37
-
38
-
39
-
40
-
41
-
42
-
43
-
44
-
45
-
46
-
47
-
48
-
49
-
50
-
51
-
52
-
53
-
54
-
55
-
56
-
57
-
58
-
59
-
60
-
61
-
62
-
63
-
64
-
65
-
66
-
67
-
68
-
69
-
70
-
 71
71 -
 72
72 -
 73
73 -
 74
74 -
 75
75 -
 76
76 -
 77
77 -
 78
78 -
 79
79 -
 80
80 -
 81
81 -
 82
82 -
 83
83 -
 84
84 -
 85
85 -
 86
86 -
 87
87 -
 88
88 -
 89
89 -
 90
90 -
 91
91 -
92
-
93
-
94
-
95
-
96
-
97
-
98
-
99
-
100
-
101
-
102
-
103
-
104
-
105
-
106
-
107
-
108
-
109
-
110
-
111
-
112
-
113
-
114
-
115
-
116
-
117
-
118
-
119
-
120
-
121
-
122
-
123
-
124
 |
 |

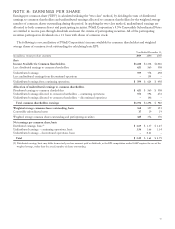
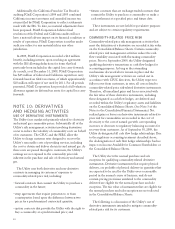
NOTE 8: EARNINGS PER SHARE
Earnings per common share (“EPS”) is calculated utilizing the “two-class” method, by dividing the sum of distributed
earnings to common shareholders and undistributed earnings allocated to common shareholders by the weighted average
number of common shares outstanding during the period. In applying the two-class method, undistributed earnings are
allocated to both common shares and participating securities. PG&E Corporation’s 9.5% Convertible Subordinated Notes
are entitled to receive pass-through dividends and meet the criteria of participating securities. All of the participating
securities participate in dividends on a 1:1 basis with shares of common stock.
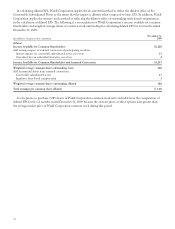
The following is a reconciliation of PG&E Corporation’s income available for common shareholders and weighted
average shares of common stock outstanding for calculating basic EPS:
Year Ended December 31,
(in millions, except per share amounts) 2009 2008 2007
Basic
Income Available for Common Shareholders $1,220 $1,338 $1,006
Less: distributed earnings to common shareholders 621 560 508
Undistributed earnings 599 778 498
Less: undistributed earnings from discontinued operations –154 –
Undistributed earnings from continuing operations $ 599 $ 624 $ 498
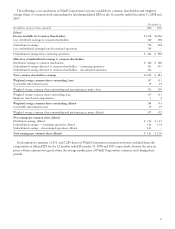
Allocation of undistributed earnings to common shareholders
Distributed earnings to common shareholders $ 621 $ 560 $ 508
Undistributed earnings allocated to common shareholders — continuing operations 573 592 472
Undistributed earnings allocated to common shareholders — discontinued operations –146 –
Total common shareholders earnings $1,194 $1,298 $ 980
Weighted average common shares outstanding, basic 368 357 351
Convertible subordinated notes 17 19 19
Weighted average common shares outstanding and participating securities 385 376 370
Net earnings per common share, basic
Distributed earnings, basic(1) $ 1.69 $ 1.57 $ 1.45
Undistributed earnings — continuing operations, basic 1.56 1.66 1.34
Undistributed earnings — discontinued operations, basic –0.41 –
Total $ 3.25 $ 3.64 $ 2.79
(1) Distributed earnings, basic may differ from actual per share amounts paid as dividends, as the EPS computation under GAAP requires the use of the
weighted average, rather than the actual, number of shares outstanding.
77