PG&E 2009 Annual Report Download - page 57
Download and view the complete annual report
Please find page 57 of the 2009 PG&E annual report below. You can navigate through the pages in the report by either clicking on the pages listed below, or by using the keyword search tool below to find specific information within the annual report.-
 1
1 -
2
-
3
-
4
-
5
-
6
-
7
-
8
-
9
-
10
-
11
-
12
-
13
-
14
-
15
-
16
-
17
-
18
-
19
-
20
-
21
-
22
-
23
-
24
-
25
-
26
-
27
-
28
-
29
-
30
-
31
-
32
-
33
-
34
-
35
-
36
-
37
-
38
-
39
-
40
-
41
-
42
-
43
-
44
-
45
-
46
-
 47
47 -
 48
48 -
 49
49 -
 50
50 -
 51
51 -
 52
52 -
 53
53 -
 54
54 -
 55
55 -
 56
56 -
 57
57 -
 58
58 -
 59
59 -
 60
60 -
 61
61 -
 62
62 -
 63
63 -
 64
64 -
 65
65 -
 66
66 -
 67
67 -
68
-
69
-
70
-
71
-
72
-
73
-
74
-
75
-
76
-
77
-
78
-
79
-
80
-
81
-
82
-
83
-
84
-
85
-
86
-
87
-
88
-
89
-
90
-
91
-
92
-
93
-
94
-
95
-
96
-
97
-
98
-
99
-
100
-
101
-
102
-
103
-
104
-
105
-
106
-
107
-
108
-
109
-
110
-
111
-
112
-
113
-
114
-
115
-
116
-
117
-
118
-
119
-
120
-
121
-
122
-
123
-
124
 |
 |

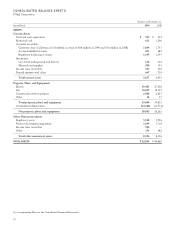
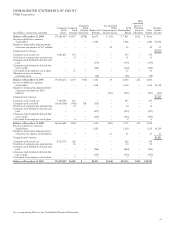
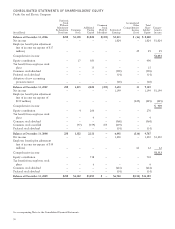
CONSOLIDATED STATEMENTS OF EQUITY
PG&E Corporation
(in millions, except share amounts)
Common
Stock
Shares
Common
Stock
Amount
Common
Stock
Held by
Subsidiary Reinvested
Earnings
Accumulated
Other
Comprehensive
Income (Loss)
Total
Shareholders’
Equity
Non-
controlling
Interest –
Preferred
Stock of
Subsidiary Total
Equity
Compre-
hensive
Income
Balance at December 31, 2006 374,181,059 $5,877 $(718) $2,671 $ (19) $ 7,811 $252 $ 8,063
Income available for common
shareholders — — — 1,006 — 1,006 — 1,006 $1,006
Employee benefit plan adjustment (net
of income tax expense of $17 million) — — — — 29 29 — 29 29
Comprehensive income $1,035
Common stock issued, net 5,465,217 175 — — — 175 — 175
Stock-based compensation amortization — 31 — — — 31 — 31
Common stock dividends declared and
paid — — — (379) — (379) — (379)
Common stock dividends declared but
not yet paid — — — (129) — (129) — (129)
Tax benefit from employee stock plans — 27 — — — 27 — 27
Adoption of new accounting
pronouncement — — — (18) — (18) — (18)
Balance at December 31, 2007 379,646,276 6,110 (718) 3,151 10 8,553 252 8,805
Income available for common
shareholders — — — 1,338 — 1,338 — 1,338 $1,338
Employee benefit plan adjustment (net
of income tax benefit of $156
million) — — — — (231) (231) — (231) (231)
Comprehensive income $1,107
Common stock issued, net 7,365,909 247 — — — 247 — 247
Common stock cancelled (24,665,500) (403) 718 (315) — — — —
Stock-based compensation amortization — 24 — — — 24 — 24
Common stock dividends declared and
paid — — — (417) — (417) — (417)
Common stock dividends declared but
not yet paid — — — (143) — (143) — (143)
Tax benefit from employee stock plans — 6 — — — 6 — 6
Balance at December 31, 2008 362,346,685 5,984 — 3,614 (221) 9,377 252 9,629
Income available for common
shareholders — — — 1,220 — 1,220 — 1,220 $1,220
Employee benefit plan adjustment (net
of income tax expense of $8 million) — — — — 61 61 — 61 61
Comprehensive income $1,281
Common stock issued, net 8,925,772 269 — — — 269 — 269
Stock-based compensation amortization — 20 — — — 20 — 20
Common stock dividends declared and
paid — — — (464) — (464) — (464)
Common stock dividends declared but
not yet paid — — — (157) — (157) — (157)
Tax benefit from employee stock plans — 7 — — — 7 — 7
Balance at December 31, 2009 371,272,457 $6,280 $ — $4,213 $(160) $10,333 $252 $10,585
See accompanying Notes to the Consolidated Financial Statements.
53