PG&E 2009 Annual Report Download - page 101
Download and view the complete annual report
Please find page 101 of the 2009 PG&E annual report below. You can navigate through the pages in the report by either clicking on the pages listed below, or by using the keyword search tool below to find specific information within the annual report.-
 1
1 -
2
-
3
-
4
-
5
-
6
-
7
-
8
-
9
-
10
-
11
-
12
-
13
-
14
-
15
-
16
-
17
-
18
-
19
-
20
-
21
-
22
-
23
-
24
-
25
-
26
-
27
-
28
-
29
-
30
-
31
-
32
-
33
-
34
-
35
-
36
-
37
-
38
-
39
-
40
-
41
-
42
-
43
-
44
-
45
-
46
-
47
-
48
-
49
-
50
-
51
-
52
-
53
-
54
-
55
-
56
-
57
-
58
-
59
-
60
-
61
-
62
-
63
-
64
-
65
-
66
-
67
-
68
-
69
-
70
-
71
-
72
-
73
-
74
-
75
-
76
-
77
-
78
-
79
-
80
-
81
-
82
-
83
-
84
-
85
-
86
-
87
-
88
-
89
-
90
-
 91
91 -
 92
92 -
 93
93 -
 94
94 -
 95
95 -
 96
96 -
 97
97 -
 98
98 -
 99
99 -
 100
100 -
 101
101 -
 102
102 -
 103
103 -
 104
104 -
 105
105 -
 106
106 -
 107
107 -
 108
108 -
 109
109 -
 110
110 -
 111
111 -
112
-
113
-
114
-
115
-
116
-
117
-
118
-
119
-
120
-
121
-
122
-
123
-
124
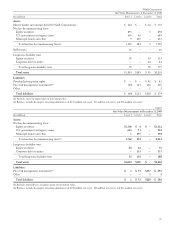
 |
 |

MEDICARE PRESCRIPTION DRUG,
IMPROVEMENT AND MODERNIZATION ACT OF
2003
The Medicare Prescription Drug, Improvement, and
Modernization Act of 2003 establishes a prescription drug
benefit under Medicare (“Medicare Part D”) and a
tax-exempt federal subsidy to sponsors of retiree health care
benefit plans that provide a benefit that actuarially is at
least equivalent to Medicare Part D. PG&E Corporation
and the Utility determined that benefits provided to certain
participants actuarially will be at least equivalent to
Medicare Part D. Therefore, PG&E Corporation and the
Utility are entitled to a tax-exempt subsidy that reduced the
accumulated postretirement benefit obligation under the
defined benefit medical plan at December 31, 2009 and
reduced the net periodic cost for 2009 by the following
amounts:
(in millions) PG&E Corporation
Accumulated postretirement benefit
obligation reduction $71
Net periodic benefit cost reduction 7
There was no material difference between PG&E
Corporation’s and the Utility’s Medicare Part D subsidy.
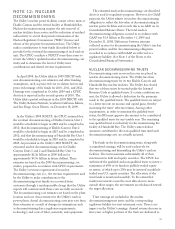
VALUATION ASSUMPTIONS
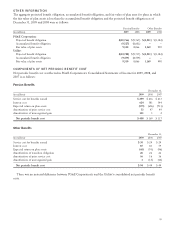
The following actuarial assumptions were used in determining the projected benefit obligations and the net periodic cost.
Weighted average year-end assumptions were used in determining the plans’ projected benefit obligations, while prior
year-end assumptions are used to compute net benefit cost.
Pension Benefits Other Benefits
December 31, December 31,
2009 2008 2007 2009 2008 2007
Discount rate 5.97% 6.31% 6.31% 5.66–6.09% 5.85–6.33% 5.52–6.42%
Average rate of future compensation increases 5.00% 5.00% 5.00% –––
Expected return on plan assets 6.80% 7.30% 7.40% 5.80–6.90% 7.00–7.30% 7.00–7.50%
The assumed health care cost trend rate for 2009 is
7.5%, decreasing gradually to an ultimate trend rate in 2014
and beyond of approximately 5%. A one-percentage-point
change in assumed health care cost trend rate would have
the following effects:
(in millions) One-Percentage-
Point Increase One-Percentage-
Point Decrease
Effect on postretirement
benefit obligation $79 $(67)
Effect on service and interest
cost 8 (6)
Expected rates of return on plan assets were developed
by determining projected stock and bond returns and then
applying these returns to the target asset allocations of the
employee benefit trusts, resulting in a weighted average rate
of return on plan assets. Fixed income returns were
projected based on real maturity and credit spreads added
to a long-term inflation rate. Equity returns were estimated
based on estimates of dividend yield and real earnings
growth added to a long-term rate of inflation. For the
Utility pension plan, the assumed return of 6.8% compares
to a ten-year actual return of 4.7%. The rate used to
discount pension and other post-retirement benefit plan
liabilities was based on a yield curve developed from
market data of over approximately 500 Aa-grade
non-callable bonds at December 31, 2009. This yield curve
has discount rates that vary based on the duration of the
obligations. The estimated future cash flows for the
pension and other benefit obligations were matched to the
corresponding rates on the yield curve to derive a weighted
average discount rate.
The difference between actual and expected return on
plan assets is included in unrecognized gain (loss), and is
considered in the determination of future net periodic
benefit income (cost). The actual return on plan assets was
above the expected return in 2008 and 2007. The actual
return on plan assets for 2009 was lower than the expected
return due to the significant decline in equity market values
that occurred in 2009.
INVESTMENT POLICIES AND STRATEGIES
The financial position of PG&E Corporation’s and the
Utility’s funded employee benefit plans is driven by the
relationship between plan assets and liabilities. As noted
above, the funded status is the difference between the fair
value of plan assets and projected benefit obligations.
Volatility in funded status occurs when asset values change
differently from liability values and can result in
fluctuations in costs for financial reporting as well as the
amount of minimum contributions required under the
97