PG&E 2009 Annual Report Download - page 61
Download and view the complete annual report
Please find page 61 of the 2009 PG&E annual report below. You can navigate through the pages in the report by either clicking on the pages listed below, or by using the keyword search tool below to find specific information within the annual report.-
 1
1 -
2
-
3
-
4
-
5
-
6
-
7
-
8
-
9
-
10
-
11
-
12
-
13
-
14
-
15
-
16
-
17
-
18
-
19
-
20
-
21
-
22
-
23
-
24
-
25
-
26
-
27
-
28
-
29
-
30
-
31
-
32
-
33
-
34
-
35
-
36
-
37
-
38
-
39
-
40
-
41
-
42
-
43
-
44
-
45
-
46
-
47
-
48
-
49
-
50
-
 51
51 -
 52
52 -
 53
53 -
 54
54 -
 55
55 -
 56
56 -
 57
57 -
 58
58 -
 59
59 -
 60
60 -
 61
61 -
 62
62 -
 63
63 -
 64
64 -
 65
65 -
 66
66 -
 67
67 -
 68
68 -
 69
69 -
 70
70 -
 71
71 -
72
-
73
-
74
-
75
-
76
-
77
-
78
-
79
-
80
-
81
-
82
-
83
-
84
-
85
-
86
-
87
-
88
-
89
-
90
-
91
-
92
-
93
-
94
-
95
-
96
-
97
-
98
-
99
-
100
-
101
-
102
-
103
-
104
-
105
-
106
-
107
-
108
-
109
-
110
-
111
-
112
-
113
-
114
-
115
-
116
-
117
-
118
-
119
-
120
-
121
-
122
-
123
-
124
 |
 |

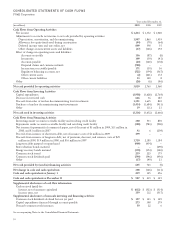
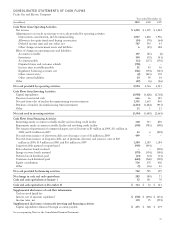
CONSOLIDATED STATEMENTS OF CASH FLOWS
Pacific Gas and Electric Company
Year ended December 31,
(in millions) 2009 2008 2007
Cash Flows from Operating Activities
Net income $ 1,250 $ 1,199 $ 1,024
Adjustments to reconcile net income to net cash provided by operating activities:
Depreciation, amortization, and decommissioning 1,927 1,838 1,956
Allowance for equity funds used during construction (94) (70) (64)
Deferred income taxes and tax credits, net 787 593 43
Other changes in noncurrent assets and liabilities 6(25) 188
Effect of changes in operating assets and liabilities:
Accounts receivable 157 (83) (6)
Inventories 109 (59) (41)
Accounts payable (33) (137) (196)
Disputed claims and customer refunds (700) ——
Income taxes receivable/payable 21 43 56
Regulatory balancing accounts, net (521) (394) (567)
Other current assets (2) (223) 170
Other current liabilities 24 90 24
Other (27) (6) (46)
Net cash provided by operating activities 2,904 2,766 2,541
Cash Flows from Investing Activities
Capital expenditures (3,958) (3,628) (2,768)
Decrease in restricted cash 666 36 185
Proceeds from sales of nuclear decommissioning trust investments 1,351 1,635 830
Purchases of nuclear decommissioning trust investments (1,414) (1,684) (933)
Other 11 121
Net cash used in investing activities (3,344) (3,640) (2,665)
Cash Flows from Financing Activities
Borrowings under accounts receivable facility and revolving credit facility 300 533 850
Repayments under accounts receivable facility and revolving credit facility (300) (783) (900)
Net issuance (repayments) of commercial paper, net of discount of $3 million in 2009, $11 million in
2008, and $1 million in 2007 43 6 (209)
Proceeds from issuance of short-term debt, net of issuance costs of $1 million in 2009 499 ——
Proceeds from issuance of long-term debt, net of premium, discount, and issuance costs of $25
million in 2009, $19 million in 2008, and $16 million in 2007 1,384 2,185 1,184
Long-term debt matured or repurchased (909) (454) —
Rate reduction bonds matured —— (290)
Energy recovery bonds matured (370) (354) (340)
Preferred stock dividends paid (14) (14) (14)
Common stock dividends paid (624) (568) (509)
Equity contribution 718 270 400
Other (5) (36) 23
Net cash provided by financing activities 722 785 195
Net change in cash and cash equivalents 282 (89) 71
Cash and cash equivalents at January 1 52 141 70
Cash and cash equivalents at December 31 $ 334 $ 52 $ 141
Supplemental disclosures of cash flow information
Cash received (paid) for:
Interest, net of amounts capitalized $ (578) $ (496) $ (474)
Income taxes, net 170 95 (594)
Supplemental disclosures of noncash investing and financing activities
Capital expenditures financed through accounts payable $ 273 $ 348 $ 279
See accompanying Notes to the Consolidated Financial Statements.
57