PG&E 2009 Annual Report Download - page 22
Download and view the complete annual report
Please find page 22 of the 2009 PG&E annual report below. You can navigate through the pages in the report by either clicking on the pages listed below, or by using the keyword search tool below to find specific information within the annual report.-
 1
1 -
2
-
3
-
4
-
5
-
6
-
7
-
8
-
9
-
10
-
11
-
 12
12 -
 13
13 -
 14
14 -
 15
15 -
 16
16 -
 17
17 -
 18
18 -
 19
19 -
 20
20 -
 21
21 -
 22
22 -
 23
23 -
 24
24 -
 25
25 -
 26
26 -
 27
27 -
 28
28 -
 29
29 -
 30
30 -
 31
31 -
 32
32 -
33
-
34
-
35
-
36
-
37
-
38
-
39
-
40
-
41
-
42
-
43
-
44
-
45
-
46
-
47
-
48
-
49
-
50
-
51
-
52
-
53
-
54
-
55
-
56
-
57
-
58
-
59
-
60
-
61
-
62
-
63
-
64
-
65
-
66
-
67
-
68
-
69
-
70
-
71
-
72
-
73
-
74
-
75
-
76
-
77
-
78
-
79
-
80
-
81
-
82
-
83
-
84
-
85
-
86
-
87
-
88
-
89
-
90
-
91
-
92
-
93
-
94
-
95
-
96
-
97
-
98
-
99
-
100
-
101
-
102
-
103
-
104
-
105
-
106
-
107
-
108
-
109
-
110
-
111
-
112
-
113
-
114
-
115
-
116
-
117
-
118
-
119
-
120
-
121
-
122
-
123
-
124
 |
 |
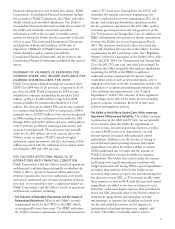
The Utility’s future cost of natural gas will be affected
by the market price of natural gas and changes in customer
demand. In addition, the Utility’s future cost of gas may be
affected by federal or state legislation or rules to regulate
the GHG emissions from the Utility’s natural gas
transportation and distribution facilities and from natural
gas consumed by the Utility’s customers.
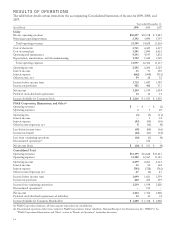
Operating and Maintenance
Operating and maintenance expenses consist mainly of the
Utility’s costs to operate and maintain its electricity and
natural gas facilities, customer billing and service expenses,
the cost of public purpose programs, and administrative
and general expenses. Operating and maintenance expenses
are influenced by wage inflation; changes in liabilities for
employee benefits; property taxes; the timing and length of
Diablo Canyon refueling outages; the occurrence of
storms, wildfires, and other events causing outages and
damages in the Utility’s service territory; environmental
remediation costs; legal costs; materials costs; the level of
uncollectible customer accounts; and various other factors.
Although some of the Utility’s operating and maintenance
expenses, like the cost of public purpose programs, are
passed through to customers and generally do not impact
net income, many other expenses are less predictable and
less controllable and do impact net income. The Utility’s
ability to earn its authorized rate of return depends in large
part on the success of its ability to manage these expenses
and to achieve operational and cost efficiencies.
The Utility’s operating and maintenance expenses
(including costs passed through to customers) increased by
$146 million, or 3%, in 2009 compared to 2008. During
2009, the pass-through costs of public purpose programs
decreased by $111 million as compared to the level of
program spending in 2008. Excluding costs passed through
to customers, operating and maintenance expenses
increased by $257 million, primarily due to approximately
$100 million of costs to perform accelerated natural gas
leak surveys and associated remedial work, $67 million of
employee severance costs incurred due to the reduction of
approximately 2% of the Utility’s workforce, $42 million of
costs related to the SmartMeterTM advanced metering
project, and $35 million of costs for the second refueling
outage at Diablo Canyon. The remaining increase consists
primarily of employee wage and benefit costs that were
partially offset by lower storm-related costs as compared to
2008 when costs were incurred in connection with the
January 2008 winter storm.
The Utility’s operating and maintenance expenses
increased by $325 million, or 8%, in 2008 compared to
2007. This increase reflects a $290 million increase in the
cost of public purpose programs compared to the level of
spending in 2007, as program spending typically increases in
the last year of a three-year program cycle. Program costs are
passed through to customers and generally do not impact net
income. Excluding items passed through to customers,
operating and maintenance expenses increased by $35 million,
primarily due to $39 million of costs to conduct expanded
natural gas leak surveys in parts of the Utility’s service territory
and to make related repairs in an effort to improve operating
and maintenance processes in the Utility’s natural gas system,
$38 million of labor expenses consisting of the labor costs that
were incurred in connection with the January 2008 winter
storm (there was no similar storm in the same period in 2007),
and $10 million of maintenance costs due to the longer
duration of the planned outage of Diablo Canyon Unit 2 in
2008 compared to the Diablo Canyon Unit 1 outage in 2007.
These increases were partially offset by a decrease of $12
million of costs as compared to 2007, when the CPUC
ordered the Utility to make customer refunds related to billing
practices.
The Utility anticipates that it will incur higher costs in
the future to improve the safety and reliability of its electric
and natural gas system infrastructure and to maintain its
aging electric distribution system. The Utility also expects
that it will incur higher expenses in future periods to obtain
permits or comply with permitting requirements, including
costs associated with renewing FERC licenses for the
Utility’s hydroelectric generation facilities. Also, in January
2010, the Utility incurred approximately $20 million of
additional expenses in connection with winter storms. To
help offset these increased costs, the Utility intends to
continue its efforts to identify and implement initiatives to
achieve operational efficiencies and to create future
sustainable cost savings.
Depreciation, Amortization, and Decommissioning
The Utility’s depreciation and amortization expense
consists of depreciation and amortization on plant and
regulatory assets, and decommissioning expenses associated
with fossil and nuclear decommissioning. The Utility’s
depreciation, amortization, and decommissioning expenses
increased by $102 million, or 6%, in 2009 compared to
2008, primarily due to an increase in authorized capital
additions and depreciation rate changes.
The Utility’s depreciation, amortization, and
decommissioning expenses decreased by $119 million, or
7% in 2008 compared to 2007, mainly due to decreases in
amortization expense related to the RRB regulatory asset.
The RRB regulatory asset was fully recovered through rates
when the RRBs matured in December 2007; therefore, no
amortization was recorded in 2008. These decreases were
partially offset by increases to depreciation expense primarily
due to capital additions and depreciation rate changes.
18