PG&E 2009 Annual Report Download - page 13
Download and view the complete annual report
Please find page 13 of the 2009 PG&E annual report below. You can navigate through the pages in the report by either clicking on the pages listed below, or by using the keyword search tool below to find specific information within the annual report.-
 1
1 -
2
-
 3
3 -
 4
4 -
 5
5 -
 6
6 -
 7
7 -
 8
8 -
 9
9 -
 10
10 -
 11
11 -
 12
12 -
 13
13 -
 14
14 -
 15
15 -
 16
16 -
 17
17 -
 18
18 -
 19
19 -
 20
20 -
 21
21 -
 22
22 -
 23
23 -
24
-
25
-
26
-
27
-
28
-
29
-
30
-
31
-
32
-
33
-
34
-
35
-
36
-
37
-
38
-
39
-
40
-
41
-
42
-
43
-
44
-
45
-
46
-
47
-
48
-
49
-
50
-
51
-
52
-
53
-
54
-
55
-
56
-
57
-
58
-
59
-
60
-
61
-
62
-
63
-
64
-
65
-
66
-
67
-
68
-
69
-
70
-
71
-
72
-
73
-
74
-
75
-
76
-
77
-
78
-
79
-
80
-
81
-
82
-
83
-
84
-
85
-
86
-
87
-
88
-
89
-
90
-
91
-
92
-
93
-
94
-
95
-
96
-
97
-
98
-
99
-
100
-
101
-
102
-
103
-
104
-
105
-
106
-
107
-
108
-
109
-
110
-
111
-
112
-
113
-
114
-
115
-
116
-
117
-
118
-
119
-
120
-
121
-
122
-
123
-
124
 |
 |

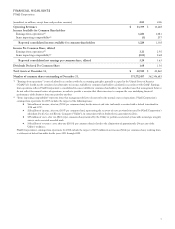
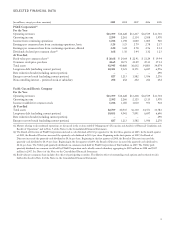
SELECTED FINANCIAL DATA
(in millions, except per share amounts) 2009 2008 2007 2006 2005
PG&E Corporation(1)
For the Year
Operating revenues $13,399 $14,628 $13,237 $12,539 $11,703
Operating income 2,299 2,261 2,114 2,108 1,970
Income from continuing operations 1,234 1,198 1,020 1,005 920
Earnings per common share from continuing operations, basic 3.25 3.23 2.79 2.78 2.37
Earnings per common share from continuing operations, diluted 3.20 3.22 2.78 2.76 2.34
Dividends declared per common share(2) 1.68 1.56 1.44 1.32 1.23
At Year-End
Book value per common share(3) $ 26.68 $ 24.64 $ 22.91 $ 21.24 $ 19.94
Common stock price per share 44.65 38.71 43.09 47.33 37.12
Total assets 42,945 40,860 36,632 34,803 34,074
Long-term debt (excluding current portion) 10,381 9,321 8,171 6,697 6,976
Rate reduction bonds (excluding current portion) ————290
Energy recovery bonds (excluding current portion) 827 1,213 1,582 1,936 2,276
Noncontrolling interest – preferred stock of subsidiary 252 252 252 252 252
Pacific Gas and Electric Company
For the Year
Operating revenues $13,399 $14,628 $13,238 $12,539 $11,704
Operating income 2,302 2,266 2,125 2,115 1,970
Income available for common stock 1,236 1,185 1,010 971 918
At Year-End
Total assets 42,709 40,537 36,310 34,371 33,783
Long-term debt (excluding current portion) 10,033 9,041 7,891 6,697 6,696
Rate reduction bonds (excluding current portion) ————290
Energy recovery bonds (excluding current portion) 827 1,213 1,582 1,936 2,276
(1) Matters relating to discontinued operations are discussed in the section entitled “Management’s Discussion and Analysis of Financial Condition and
Results of Operations” and in Note 9 of the Notes to the Consolidated Financial Statements.
(2) The Board of Directors of PG&E Corporation declared a cash dividend of $0.30 per quarter for the first three quarters of 2005. In the fourth quarter
of 2005, the Board of Directors increased the quarterly cash dividend to $0.33 per share. Beginning in the first quarter of 2007, the Board of
Directors increased the quarterly cash dividend to $0.36 per share. Beginning in the first quarter of 2008, the Board of Directors increased the
quarterly cash dividend to $0.39 per share. Beginning in the first quarter of 2009, the Board of Directors increased the quarterly cash dividend to
$0.42 per share. The Utility paid quarterly dividends on common stock held by PG&E Corporation of $624 million in 2009. The Utility paid
quarterly dividends on common stock held by PG&E Corporation and a wholly owned subsidiary aggregating to $589 million in 2008 and $547
million in 2007. See Note 6 of the Notes to the Consolidated Financial Statements.
(3) Book value per common share includes the effect of participating securities. The dilutive effect of outstanding stock options and restricted stock is
further disclosed in Note 8 of the Notes to the Consolidated Financial Statements.
9