PG&E 2009 Annual Report Download - page 64
Download and view the complete annual report
Please find page 64 of the 2009 PG&E annual report below. You can navigate through the pages in the report by either clicking on the pages listed below, or by using the keyword search tool below to find specific information within the annual report.-
 1
1 -
2
-
3
-
4
-
5
-
6
-
7
-
8
-
9
-
10
-
11
-
12
-
13
-
14
-
15
-
16
-
17
-
18
-
19
-
20
-
21
-
22
-
23
-
24
-
25
-
26
-
27
-
28
-
29
-
30
-
31
-
32
-
33
-
34
-
35
-
36
-
37
-
38
-
39
-
40
-
41
-
42
-
43
-
44
-
45
-
46
-
47
-
48
-
49
-
50
-
51
-
52
-
53
-
 54
54 -
 55
55 -
 56
56 -
 57
57 -
 58
58 -
 59
59 -
 60
60 -
 61
61 -
 62
62 -
 63
63 -
 64
64 -
 65
65 -
 66
66 -
 67
67 -
 68
68 -
 69
69 -
 70
70 -
 71
71 -
 72
72 -
 73
73 -
 74
74 -
75
-
76
-
77
-
78
-
79
-
80
-
81
-
82
-
83
-
84
-
85
-
86
-
87
-
88
-
89
-
90
-
91
-
92
-
93
-
94
-
95
-
96
-
97
-
98
-
99
-
100
-
101
-
102
-
103
-
104
-
105
-
106
-
107
-
108
-
109
-
110
-
111
-
112
-
113
-
114
-
115
-
116
-
117
-
118
-
119
-
120
-
121
-
122
-
123
-
124
 |
 |

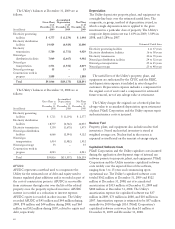
The Utility’s balances at December 31, 2009 are as
follows:
(in millions)
Gross Plant
as of
December 31,
2009
Accumulated
Depreciation
as of
December 31,
2009
Net Plant
as of
December 31,
2009
Electricity generating
facilities $ 4,777 $ (1,279) $ 3,498
Electricity distribution
facilities 19,924 (6,924) 13,000
Electricity
transmission 5,780 (1,751) 4,029
Natural gas
distribution facilities 7,069 (2,667) 4,402
Natural gas
transportation 3,573 (1,554) 2,019
Natural gas storage 55 — 55
Construction work in
progress 1,888 — 1,888
Total $43,066 $(14,175) $28,891
The Utility’s balances at December 31, 2008 are as
follows:
(in millions)
Gross Plant as
of
December 31,
2008
Accumulated
Depreciation
as of
December 31,
2008
Net Plant
as of
December 31,
2008
Electricity generating
facilities $ 3,711 $ (1,134) $ 2,577
Electricity distribution
facilities 18,777 (6,722) 12,055
Electricity transmission 5,150 (1,675) 3,475
Natural gas distribution
facilities 6,666 (2,544) 4,122
Natural gas
transportation 3,434 (1,482) 1,952
Natural gas storage 55 — 55
Construction work in
progress 2,023 — 2,023
Total $39,816 $(13,557) $26,259
AFUDC
AFUDC represents a method used to compensate the
Utility for the estimated cost of debt and equity used to
finance regulated plant additions and is recorded as part of
the cost of construction projects. AFUDC is recoverable
from customers through rates over the life of the related
property once the property is placed in service. AFUDC
interest is recorded as a reduction to interest expense.
AFUDC equity is recorded in other income. The Utility
recorded AFUDC of $95 million and $44 million during
2009, $70 million and $44 million during 2008, and $64
million and $32 million during 2007, related to equity and
debt, respectively.
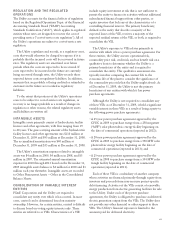
Depreciation
The Utility depreciates property, plant, and equipment on
a straight-line basis over the estimated useful lives. The
composite, or group, method of depreciation is used, in
which a single depreciation rate is applied to the gross
investment in a particular class of property. The Utility’s
composite depreciation rate was 3.43% in 2009, 3.38% in
2008, and 3.28% in 2007.
Estimated Useful Lives
Electricity generating facilities 4 to 37 years
Electricity distribution facilities 16 to 58 years
Electricity transmission 40 to 70 years
Natural gas distribution facilities 24 to 52 years
Natural gas transportation 25 to 45 years
Natural gas storage 25 to 48 years
The useful lives of the Utility’s property, plant, and
equipment are authorized by the CPUC and the FERC,
and depreciation expense is included in rates charged to
customers. Depreciation expense includes a component for
the original cost of assets and a component for estimated
future removal, net of any salvage value at retirement.
The Utility charges the original cost of retired plant less
salvage value to accumulated depreciation upon retirement
of plant. PG&E Corporation and the Utility expense repair
and maintenance costs as incurred.
Nuclear Fuel
Property, plant, and equipment also include nuclear fuel
inventories. Stored nuclear fuel inventory is stated at
weighted average cost. Nuclear fuel in the reactor is
expensed as used based on the amount of energy output.
Capitalized Software Costs
PG&E Corporation and the Utility capitalize costs incurred
during the application development stage of internal use
software projects to property, plant, and equipment. PG&E
Corporation and the Utility amortize capitalized software
costs ratably over the expected lives of the software,
ranging from 3 to 15 years and commencing upon
operational use. The Utility’s capitalized software costs
totaled $562 million at December 31, 2009 and $522
million at December 31, 2008, net of accumulated
amortization of $315 million at December 31, 2009 and
$280 million at December 31, 2008. The Utility’s
amortization expense for capitalized software was $37
million in 2009, $73 million in 2008, and $10 million in
2007. Amortization expense is estimated to be $37 million
annually for 2010 through 2014. PG&E Corporation’s
capitalized software costs were less than $1 million at
December 31, 2009 and December 31, 2008.
60