PG&E 2009 Annual Report Download - page 111
Download and view the complete annual report
Please find page 111 of the 2009 PG&E annual report below. You can navigate through the pages in the report by either clicking on the pages listed below, or by using the keyword search tool below to find specific information within the annual report.-
 1
1 -
2
-
3
-
4
-
5
-
6
-
7
-
8
-
9
-
10
-
11
-
12
-
13
-
14
-
15
-
16
-
17
-
18
-
19
-
20
-
21
-
22
-
23
-
24
-
25
-
26
-
27
-
28
-
29
-
30
-
31
-
32
-
33
-
34
-
35
-
36
-
37
-
38
-
39
-
40
-
41
-
42
-
43
-
44
-
45
-
46
-
47
-
48
-
49
-
50
-
51
-
52
-
53
-
54
-
55
-
56
-
57
-
58
-
59
-
60
-
61
-
62
-
63
-
64
-
65
-
66
-
67
-
68
-
69
-
70
-
71
-
72
-
73
-
74
-
75
-
76
-
77
-
78
-
79
-
80
-
81
-
82
-
83
-
84
-
85
-
86
-
87
-
88
-
89
-
90
-
91
-
92
-
93
-
94
-
95
-
96
-
97
-
98
-
99
-
100
-
 101
101 -
 102
102 -
 103
103 -
 104
104 -
 105
105 -
 106
106 -
 107
107 -
 108
108 -
 109
109 -
 110
110 -
 111
111 -
 112
112 -
 113
113 -
 114
114 -
 115
115 -
 116
116 -
 117
117 -
 118
118 -
 119
119 -
 120
120 -
 121
121 -
122
-
123
-
124
 |
 |

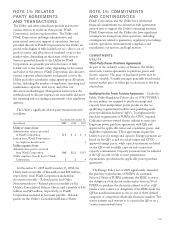
At December 31, 2009, the undiscounted future expected power purchase agreement payments were as follows:
Qualifying Facility Irrigation District &
Water Agency Renewable
(Other than QF) Other
(in millions) Energy Capacity Operations &
Maintenance Debt
Service Energy Capacity Energy Capacity Total
Payments
2010 $ 931 $ 395 $ 23 $ 51 $ 618 $ 8 $ 5 $ 252 $ 2,283
2011 845 365 21 55 855 8 6 289 2,444
2012 723 332 21 35 972 9 6 405 2,503
2013 701 322 15 27 913 9 6 431 2,424
2014 677 306 12 13 1,082 5 2 227 2,324
Thereafter 4,038 1,528 25 37 30,246 – – 1,605 37,479
Total $7,915 $3,248 $117 218 $34,686 $39 $25 $3,209 $49,457
Some of the power purchase agreements that the Utility
entered into with independent power producers that are
QFs are treated as capital leases. The following table shows
the future fixed capacity payments due under the QF
contracts that are treated as capital leases. (These amounts
are also included in the table above.) The fixed capacity
payments are discounted to their present value in the table
below using the Utility’s incremental borrowing rate at the
inception of the leases. The amount of this discount is
shown in the table below as the amount representing
interest.
(in millions)
2010 $ 50
2011 50
2012 50
2013 50
2014 42
Thereafter 162
Total fixed capacity payments 404
Less: amount representing interest 90
Present value of fixed capacity payments $314
Minimum lease payments associated with the lease
obligation are included in Cost of electricity on PG&E
Corporation’s and the Utility’s Consolidated Statements of
Income. The timing of the Utility’s recognition of the lease
expense conforms to the ratemaking treatment for the
Utility’s recovery of the cost of electricity. The QF
contracts that are treated as capital leases expire between
April 2014 and September 2021.
At December 31, 2009 and December 31, 2008, PG&E
Corporation and the Utility had, respectively, $32 million
and $30 million included in Current Liabilities — Other
and $282 million and $314 million included in Noncurrent
Liabilities — Other, representing the present value of the
fixed capacity payments due under these contracts recorded
on PG&E Corporation’s and the Utility’s Consolidated
Balance Sheets. The corresponding assets at December 31,
2009 and December 31, 2008 of $314 million and $344
million, including amortization of $94 million and $64
million, respectively, are included in Property, Plant, and
Equipment on PG&E Corporation’s and the Utility’s
Consolidated Balance Sheets.
Natural Gas Supply, Transportation, and Storage
Commitments
The Utility purchases natural gas directly from producers
and marketers in both Canada and the United States to
serve its core customers. The contract lengths and natural
gas sources of the Utility’s portfolio of natural gas
procurement contracts can fluctuate based on market
conditions. The Utility also contracts for natural gas
transportation to transport natural gas from the points at
which the Utility takes delivery (typically in Canada and
the southwestern United States) to the points at which the
Utility’s natural gas transportation system begins. In
addition, the Utility has contracted for gas storage services
in order to better meet winter peak customer loads. At
December 31, 2009, the Utility’s undiscounted obligations
for natural gas purchases, gas transportation services, and
gas storage were as follows:
(in millions)
2010 $ 660
2011 150
2012 62
2013 49
2014 44
Thereafter 115
Total $1,080
Payments for natural gas purchases, gas transportation
services, and gas storage amounted to $1.4 billion in 2009,
$2.7 billion in 2008, and $2.2 billion in 2007.
107