PG&E 2009 Annual Report Download - page 11
Download and view the complete annual report
Please find page 11 of the 2009 PG&E annual report below. You can navigate through the pages in the report by either clicking on the pages listed below, or by using the keyword search tool below to find specific information within the annual report.-
 1
1 -
 2
2 -
 3
3 -
 4
4 -
 5
5 -
 6
6 -
 7
7 -
 8
8 -
 9
9 -
 10
10 -
 11
11 -
 12
12 -
 13
13 -
 14
14 -
 15
15 -
 16
16 -
 17
17 -
 18
18 -
 19
19 -
 20
20 -
 21
21 -
 22
22 -
23
-
24
-
25
-
26
-
27
-
28
-
29
-
30
-
31
-
32
-
33
-
34
-
35
-
36
-
37
-
38
-
39
-
40
-
41
-
42
-
43
-
44
-
45
-
46
-
47
-
48
-
49
-
50
-
51
-
52
-
53
-
54
-
55
-
56
-
57
-
58
-
59
-
60
-
61
-
62
-
63
-
64
-
65
-
66
-
67
-
68
-
69
-
70
-
71
-
72
-
73
-
74
-
75
-
76
-
77
-
78
-
79
-
80
-
81
-
82
-
83
-
84
-
85
-
86
-
87
-
88
-
89
-
90
-
91
-
92
-
93
-
94
-
95
-
96
-
97
-
98
-
99
-
100
-
101
-
102
-
103
-
104
-
105
-
106
-
107
-
108
-
109
-
110
-
111
-
112
-
113
-
114
-
115
-
116
-
117
-
118
-
119
-
120
-
121
-
122
-
123
-
124
 |
 |

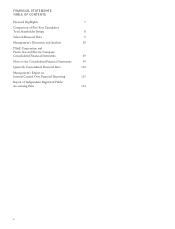
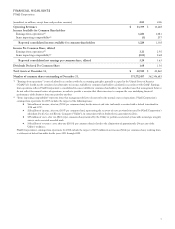
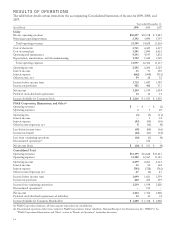
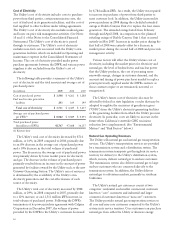
FINANCIAL HIGHLIGHTS
PG&E Corporation
(unaudited, in millions, except share and per share amounts) 2009 2008
Operating Revenues $ 13,399 $ 14,628
Income Available for Common Shareholders
Earnings from operations(1) 1,223 1,081
Items impacting comparability(2) (3) 257
Reported consolidated income available for common shareholders 1,220 1,338
Income Per Common Share, diluted
Earnings from operations(1) 3.21 2.95
Items impacting comparability(2) (0.01) 0.68
Reported consolidated net earnings per common share, diluted 3.20 3.63
Dividends Declared Per Common Share 1.68 1.56
Total Assets at December 31, $ 42,945 $ 40,860
Number of common shares outstanding at December 31, 371,272,457 362,346,685
(1) “Earnings from operations” is not calculated in accordance with the accounting principles generally accepted in the United States of America
(“GAAP”). It should not be considered an alternative to income available for common shareholders calculated in accordance with GAAP. Earnings
from operations reflects PG&E Corporation’s consolidated income available for common shareholders, but excludes items that management believes
do not reflect the normal course of operations, in order to provide a measure that allows investors to compare the core underlying financial
performance of the business from one period to another.
(2) “Items impacting comparability” represent items that management believes do not reflect the normal course of operations. PG&E Corporation’s
earnings from operations for 2009 excludes the impact of the following items:
Š$66 million of income, after tax, ($0.18 per common share) for the interest and state tax benefit associated with a federal tax refund for
1998 and 1999.
Š$28 million of income, after tax, ($0.07 per common share) representing the recovery of costs previously incurred by PG&E Corporation’s
subsidiary, Pacific Gas and Electric Company (“Utility”), in connection with its hydroelectric generation facilities.
Š$59 million of costs, after tax, (($0.16) per common share) incurred by the Utility to perform accelerated system-wide natural gas integrity
surveys and associated remedial work.
Š$38 million of severance costs, after-tax, (($0.10) per common share) related to the elimination of approximately 2% percent of the
Utility’s workforce.
PG&E Corporation’s earnings from operations for 2008 exclude the impact of $257 million in net income ($0.68 per common share) resulting from
a settlement of federal tax audits for the years 2001 through 2004.
7