PG&E 2009 Annual Report Download - page 62
Download and view the complete annual report
Please find page 62 of the 2009 PG&E annual report below. You can navigate through the pages in the report by either clicking on the pages listed below, or by using the keyword search tool below to find specific information within the annual report.-
 1
1 -
2
-
3
-
4
-
5
-
6
-
7
-
8
-
9
-
10
-
11
-
12
-
13
-
14
-
15
-
16
-
17
-
18
-
19
-
20
-
21
-
22
-
23
-
24
-
25
-
26
-
27
-
28
-
29
-
30
-
31
-
32
-
33
-
34
-
35
-
36
-
37
-
38
-
39
-
40
-
41
-
42
-
43
-
44
-
45
-
46
-
47
-
48
-
49
-
50
-
51
-
 52
52 -
 53
53 -
 54
54 -
 55
55 -
 56
56 -
 57
57 -
 58
58 -
 59
59 -
 60
60 -
 61
61 -
 62
62 -
 63
63 -
 64
64 -
 65
65 -
 66
66 -
 67
67 -
 68
68 -
 69
69 -
 70
70 -
 71
71 -
 72
72 -
73
-
74
-
75
-
76
-
77
-
78
-
79
-
80
-
81
-
82
-
83
-
84
-
85
-
86
-
87
-
88
-
89
-
90
-
91
-
92
-
93
-
94
-
95
-
96
-
97
-
98
-
99
-
100
-
101
-
102
-
103
-
104
-
105
-
106
-
107
-
108
-
109
-
110
-
111
-
112
-
113
-
114
-
115
-
116
-
117
-
118
-
119
-
120
-
121
-
122
-
123
-
124
 |
 |

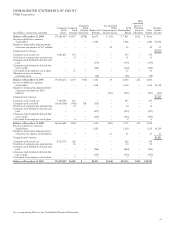
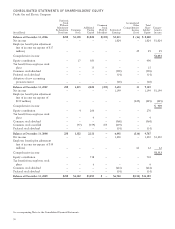
CONSOLIDATED STATEMENTS OF SHAREHOLDERS’ EQUITY
Pacific Gas and Electric Company
(in millions)
Preferred
Stock
Without
Mandatory
Redemption
Provisions Common
Stock
Additional
Paid-in
Capital
Common
Stock
Held by
Subsidiary Reinvested
Earnings
Accumulated
Other
Comprehensive
Income
(Loss)
Total
Share-
holders’
Equity
Compre-
hensive
Income
Balance at December 31, 2006 $258 $1,398 $1,822 $(475) $5,213 $ (16) $ 8,200
Net income — — — — 1,024 — 1,024 $1,024
Employee benefit plan adjustment
(net of income tax expense of $17
million) — — — — — 29 29 29
Comprehensive income $1,053
Equity contribution — 17 383 — — — 400
Tax benefit from employee stock
plans — — 15 — — — 15
Common stock dividend — — — — (509) — (509)
Preferred stock dividend — — — — (14) — (14)
Adoption of new accounting
pronouncement — — — — (20) — (20)
Balance at December 31, 2007 258 1,415 2,220 (475) 5,694 13 9,125
Net income — — — — 1,199 — 1,199 $1,199
Employee benefit plan adjustment
(net of income tax expense of
$159 million) — — — — — (229) (229) (229)
Comprehensive income $ 970
Equity contribution — 4 266 — — — 270
Tax benefit from employee stock
plans — — 4 — — — 4
Common stock dividend — — — — (568) — (568)
Common stock cancelled — (97) (159) 475 (219) — —
Preferred stock dividend — — — — (14) — (14)
Balance at December 31, 2008 258 1,322 2,331 — 6,092 (216) 9,787
Net income — — — — 1,250 — 1,250 $1,250
Employee benefit plan adjustment
(net of income tax expense of $10
million) — — — — — 62 62 62
Comprehensive income $1,312
Equity contribution — — 718 — — — 718
Tax benefit from employee stock
plans — — 6 — — — 6
Common stock dividend — — — — (624) — (624)
Preferred stock dividend — — — — (14) — (14)
Balance at December 31, 2009 $258 $1,322 $3,055 $ — $6,704 $(154) $11,185
See accompanying Notes to the Consolidated Financial Statements.
58