PG&E 2009 Annual Report Download - page 103
Download and view the complete annual report
Please find page 103 of the 2009 PG&E annual report below. You can navigate through the pages in the report by either clicking on the pages listed below, or by using the keyword search tool below to find specific information within the annual report.-
 1
1 -
2
-
3
-
4
-
5
-
6
-
7
-
8
-
9
-
10
-
11
-
12
-
13
-
14
-
15
-
16
-
17
-
18
-
19
-
20
-
21
-
22
-
23
-
24
-
25
-
26
-
27
-
28
-
29
-
30
-
31
-
32
-
33
-
34
-
35
-
36
-
37
-
38
-
39
-
40
-
41
-
42
-
43
-
44
-
45
-
46
-
47
-
48
-
49
-
50
-
51
-
52
-
53
-
54
-
55
-
56
-
57
-
58
-
59
-
60
-
61
-
62
-
63
-
64
-
65
-
66
-
67
-
68
-
69
-
70
-
71
-
72
-
73
-
74
-
75
-
76
-
77
-
78
-
79
-
80
-
81
-
82
-
83
-
84
-
85
-
86
-
87
-
88
-
89
-
90
-
91
-
92
-
 93
93 -
 94
94 -
 95
95 -
 96
96 -
 97
97 -
 98
98 -
 99
99 -
 100
100 -
 101
101 -
 102
102 -
 103
103 -
 104
104 -
 105
105 -
 106
106 -
 107
107 -
 108
108 -
 109
109 -
 110
110 -
 111
111 -
 112
112 -
 113
113 -
114
-
115
-
116
-
117
-
118
-
119
-
120
-
121
-
122
-
123
-
124
 |
 |

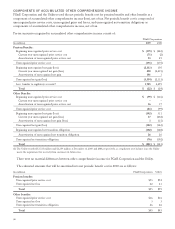
FAIR VALUE MEASUREMENTS
The following table presents the fair value of plan assets for pension and other benefit plans by major asset category for
the year ended December 31, 2009. (For a discussion of the levels and their inputs see Note 11 of the Notes to the
Consolidated Financial Statements.)
Fair Value Measurements as of December 31, 2009
(in millions) Level 1 Level 2 Level 3 Total
Pension Benefits:
U.S. Equity $ 411 $2,065 $ — $ 2,476
Non-U.S. Equity 316 1,018 — 1,334
Global Equity 162 317 — 479
Absolute Return — — 340 340
Fixed Income:
U.S. Government 585 262 — 847
Corporate 25 2,455 531 3,011
Other (8) 233 190 415
Cash Equivalents 378 31 — 409
Total $1,869 $6,381 $1,061 $ 9,311
Other Benefits:
U.S. Equity $ 88 $ 218 $ — $ 306
Non-U.S. Equity 81 68 — 149
Global Equity —8— 8
Absolute Return — — 32 32
Fixed Income:
U.S. Government 40 15 — 55
Corporate 82 275 124 481
Other (1) 13 17 29
Cash Equivalents 111 — — 111
Total $ 401 $ 597 $ 173 $ 1,171
Other Assets 17
Total Plan Assets at Fair Value $10,499
The U.S., Non-U.S., and combined Global Equity
categories include equity investments in common stock
and commingled funds comprised of equity across multiple
industries and regions of the world. Equity investments in
common stock are actively traded on a public exchange
and are therefore considered Level 1 assets. These equity
investments are generally valued based on unadjusted
prices in active markets for identical securities.
Commingled funds are maintained by investment
companies for large institutional investors and are not
publicly traded. Commingled funds are comprised
primarily of underlying equity securities that are publicly
traded on exchanges, and price quotes for the assets held
by these funds are readily observable and available.
Therefore, these commingled funds are categorized as Level
2 assets.
The Absolute Return category includes portfolios of
hedge funds that are valued based on a variety of
proprietary and non-proprietary valuation methods,
including unadjusted prices for publicly-traded securities in
active markets. Hedge funds are considered Level 3 assets.
The Fixed Income category includes U.S. government
securities, corporate securities, and other fixed income
securities. U.S. government fixed income primarily consists
of U.S. Treasury notes and U.S. governments bonds that
are valued based on unadjusted prices in active markets for
identical transactions and are considered Level 1 assets.
Corporate fixed income primarily includes investment
grade bonds of U.S. issuers across multiple industries that
are valued based on a compilation of primarily observable
information or broker quotes in non-active markets. These
securities are classified as Level 2 assets. Corporate fixed
income also includes one commingled fund comprised of
private corporate debt instruments. The fund is valued
using pricing models and valuation inputs that are
unobservable and is considered a Level 3 asset. Other fixed
income primarily includes pass-through and asset-backed
securities. Pass-through securities are valued based on
99