Motorola 2010 Annual Report Download - page 99
Download and view the complete annual report
Please find page 99 of the 2010 Motorola annual report below. You can navigate through the pages in the report by either clicking on the pages listed below, or by using the keyword search tool below to find specific information within the annual report.-
 1
1 -
2
-
3
-
4
-
5
-
6
-
7
-
8
-
9
-
10
-
11
-
12
-
13
-
14
-
15
-
16
-
17
-
18
-
19
-
20
-
21
-
22
-
23
-
24
-
25
-
26
-
27
-
28
-
29
-
30
-
31
-
32
-
33
-
34
-
35
-
36
-
37
-
38
-
39
-
40
-
41
-
42
-
43
-
44
-
45
-
46
-
47
-
48
-
49
-
50
-
51
-
52
-
53
-
54
-
55
-
56
-
57
-
58
-
59
-
60
-
61
-
62
-
63
-
64
-
65
-
66
-
67
-
68
-
69
-
70
-
71
-
72
-
73
-
74
-
75
-
76
-
77
-
78
-
79
-
80
-
81
-
82
-
83
-
84
-
85
-
86
-
87
-
88
-
 89
89 -
 90
90 -
 91
91 -
 92
92 -
 93
93 -
 94
94 -
 95
95 -
 96
96 -
 97
97 -
 98
98 -
 99
99 -
 100
100 -
 101
101 -
 102
102 -
 103
103 -
 104
104 -
 105
105 -
 106
106 -
 107
107 -
 108
108 -
 109
109 -
110
-
111
-
112
-
113
-
114
-
115
-
116
-
117
-
118
-
119
-
120
-
121
-
122
-
123
-
124
-
125
-
126
-
127
-
128
-
129
-
130
-
131
-
132
-
133
-
134
-
135
-
136
-
137
-
138
-
139
-
140
-
141
-
142
-
143
-
144
 |
 |

91
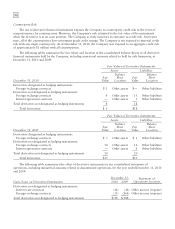
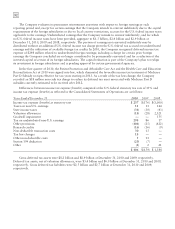
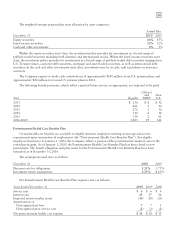
The following table summarizes the gains and losses recognized in the consolidated financial statements,
including immaterial amounts related to discontinued operations, for the years ended December 31, 2010 and 2009:
December 31,
Foreign Exchange Contracts 2010 2009
Financial Statement
Location
Derivatives in cash flow hedging relationships:
Loss recognized in Accumulated other comprehensive loss
(effective portion) $(9) $ — Accumulated other comprehensive loss
Loss reclassified from Accumulated other comprehensive loss
into Net earnings (loss) (effective portion) (6) (18) Cost of sales/Sales
Gain (loss) recognized in Net earnings (loss) on
derivative (ineffective portion and amount excluded from
effectiveness testing) 1 — Other income (expense)
Stockholders’ Equity
Derivative instruments activity, net of tax, included in Accumulated other comprehensive income (loss) within
the consolidated statements of stockholders’ equity for the years ended December 31, 2010, 2009 and 2008 is as
follows:
2010 2009 2008
Balance at January 1 $2 $ (7) $—
Increase (decrease) in fair value 321 (9)
Reclassifications to earnings, net of tax (5) (12) 2
Balance at December 31 $— $ 2 $ (7)
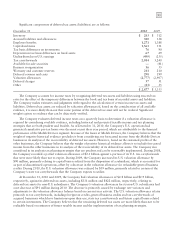
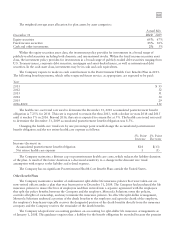
6. Income Taxes
Components of earnings (loss) from continuing operations before income taxes are as follows:
Years Ended December 31 2010 2009 2008
United States $265 $(859) $(3,743)
Other nations 412 356 890
$677 $(503) $(2,853)
Components of income tax expense (benefit) are as follows:
Years Ended December 31 2010 2009 2008
United States $7$(314) $ (618)
Other nations 160 105 490
States (U.S.) 74 6 (5)
Current income tax expense 241 (203) (133)
United States 286 18 1,751
Other nations 679 27
States (U.S.) (127) (53) (61)
Deferred income tax expense 165 44 1,717
Total income tax expense (benefit) $ 406 $(159) $1,584
Deferred tax charges that were recorded within Accumulated other comprehensive loss in the Company’s
consolidated balance sheets resulted from retirement benefit adjustments, currency translation adjustments, net
gains (losses) on derivative instruments and fair value adjustments to available-for-sale securities. The adjustments
were $41 million, $(26) million and $(738) million for the years ended December 31, 2010, 2009 and 2008,
respectively.