Motorola 2010 Annual Report Download - page 123
Download and view the complete annual report
Please find page 123 of the 2010 Motorola annual report below. You can navigate through the pages in the report by either clicking on the pages listed below, or by using the keyword search tool below to find specific information within the annual report.-
 1
1 -
2
-
3
-
4
-
5
-
6
-
7
-
8
-
9
-
10
-
11
-
12
-
13
-
14
-
15
-
16
-
17
-
18
-
19
-
20
-
21
-
22
-
23
-
24
-
25
-
26
-
27
-
28
-
29
-
30
-
31
-
32
-
33
-
34
-
35
-
36
-
37
-
38
-
39
-
40
-
41
-
42
-
43
-
44
-
45
-
46
-
47
-
48
-
49
-
50
-
51
-
52
-
53
-
54
-
55
-
56
-
57
-
58
-
59
-
60
-
61
-
62
-
63
-
64
-
65
-
66
-
67
-
68
-
69
-
70
-
71
-
72
-
73
-
74
-
75
-
76
-
77
-
78
-
79
-
80
-
81
-
82
-
83
-
84
-
85
-
86
-
87
-
88
-
89
-
90
-
91
-
92
-
93
-
94
-
95
-
96
-
97
-
98
-
99
-
100
-
101
-
102
-
103
-
104
-
105
-
106
-
107
-
108
-
109
-
110
-
111
-
112
-
 113
113 -
 114
114 -
 115
115 -
 116
116 -
 117
117 -
 118
118 -
 119
119 -
 120
120 -
 121
121 -
 122
122 -
 123
123 -
 124
124 -
 125
125 -
 126
126 -
 127
127 -
 128
128 -
 129
129 -
 130
130 -
 131
131 -
 132
132 -
 133
133 -
134
-
135
-
136
-
137
-
138
-
139
-
140
-
141
-
142
-
143
-
144
 |
 |

115
employee separation costs, $21 million for exit costs, and $6 million for fixed asset impairment charges, partially
offset by $39 million of reversals for accruals no longer needed.
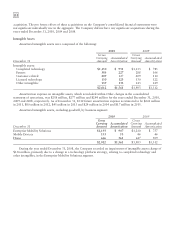
The following table displays the net charges incurred by business segment:
Year Ended December 31, 2010
Enterprise Mobility Solutions $68
Mobile Devices 34
Home 29
131
Corporate 7
$138
The following table displays a rollforward of the reorganization of businesses accruals established for exit costs
and employee separation costs from January 1, 2010 to December 31, 2010:
Accruals at
January 1, 2010
Additional
Charges Adjustments
Amount
Used
Accruals at
December 31, 2010
Exit costs $ 57 $ 21 $(11) $ (32) $ 35
Employee separation costs 65 150 (29) (121) 65
$122 $171 $(40) $(153) $100
Exit Costs
At January 1, 2010, the Company had an accrual of $57 million for exit costs attributable to lease
terminations. The additional 2010 charges were $21 million. The adjustments of $11 million primarily reflects $12
million of reversals of accruals no longer needed, partially offset by $1 million of translation adjustments. The
$32 million used in 2010 reflects cash payments. The remaining accrual of $35 million, which is included in
Accrued liabilities in the Company’s consolidated balance sheets at December 31, 2010, primarily represents future
cash payments for lease termination obligations that are expected to be paid over a number of years.
Employee Separation Costs
At January 1, 2010, the Company had an accrual of $65 million for employee separation costs, representing the
severance costs for: (i) severed employees who began receiving payments in 2009, and (ii) approximately
1,200 employees who began receiving payments in 2010. The 2010 additional charges of $150 million represent
severance costs for approximately an additional 3,300 employees, of which 1,800 were direct employees and 1,500
were indirect employees.
The adjustments of $29 million reflect: (i) $27 million of reversals of accruals no longer needed, and
(ii) $2 million of translation adjustments.
During 2010, approximately 2,200 employees, of which 900 were direct employees and 1,300 were indirect
employees, were separated from the Company. The $121 million used in 2010 reflects cash payments to separated
employees. The remaining accrual of $65 million, which is included in Accrued liabilities in the Company’s
consolidated balance sheets at December 31, 2010, is expected to be paid, generally, within one year to: (i) severed
employees who have already begun to receive payments, and (ii) approximately 3,800 employees to be separated in
2011.
2009 Charges
During 2009, in light of the macroeconomic decline that adversely affected sales, the Company continued to
implement various productivity improvement plans aimed at achieving long-term, sustainable profitability by
driving efficiencies and reducing operating costs. All three of the Company’s business segments, as well as corporate
functions, are impacted by these plans, with the majority of the impact in the Mobile Devices segment. The
employees affected are located in all geographic regions.