Motorola 2010 Annual Report Download - page 121
Download and view the complete annual report
Please find page 121 of the 2010 Motorola annual report below. You can navigate through the pages in the report by either clicking on the pages listed below, or by using the keyword search tool below to find specific information within the annual report.-
 1
1 -
2
-
3
-
4
-
5
-
6
-
7
-
8
-
9
-
10
-
11
-
12
-
13
-
14
-
15
-
16
-
17
-
18
-
19
-
20
-
21
-
22
-
23
-
24
-
25
-
26
-
27
-
28
-
29
-
30
-
31
-
32
-
33
-
34
-
35
-
36
-
37
-
38
-
39
-
40
-
41
-
42
-
43
-
44
-
45
-
46
-
47
-
48
-
49
-
50
-
51
-
52
-
53
-
54
-
55
-
56
-
57
-
58
-
59
-
60
-
61
-
62
-
63
-
64
-
65
-
66
-
67
-
68
-
69
-
70
-
71
-
72
-
73
-
74
-
75
-
76
-
77
-
78
-
79
-
80
-
81
-
82
-
83
-
84
-
85
-
86
-
87
-
88
-
89
-
90
-
91
-
92
-
93
-
94
-
95
-
96
-
97
-
98
-
99
-
100
-
101
-
102
-
103
-
104
-
105
-
106
-
107
-
108
-
109
-
110
-
 111
111 -
 112
112 -
 113
113 -
 114
114 -
 115
115 -
 116
116 -
 117
117 -
 118
118 -
 119
119 -
 120
120 -
 121
121 -
 122
122 -
 123
123 -
 124
124 -
 125
125 -
 126
126 -
 127
127 -
 128
128 -
 129
129 -
 130
130 -
 131
131 -
132
-
133
-
134
-
135
-
136
-
137
-
138
-
139
-
140
-
141
-
142
-
143
-
144
 |
 |

113
protocol television (“IPTV”) distribution systems, broadband access network infrastructure platforms, and
associated data and voice customer premises equipment and associated software solutions to cable television
(“TV”) and telecommunication service providers.
Segment operating results are measured based on operating earnings adjusted, if necessary, for certain
segment-specific items and corporate allocations. Intersegment and intergeographic sales are accounted for on an
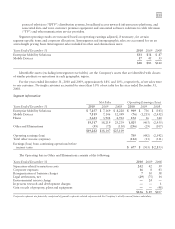
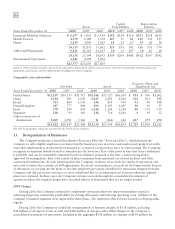
arm’s-length pricing basis. Intersegment sales included in other and eliminations were:
Years Ended December 31 2010 2009 2008
Enterprise Mobility Solutions $31 $38 $ 87
Mobile Devices 17 45 53
$48 $83 $140
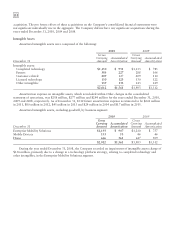
Identifiable assets (excluding intersegment receivables) are the Company’s assets that are identified with classes
of similar products or operations in each geographic region.
For the years ended December 31, 2010 and 2009, approximately 18% and 10%, respectively, of net sales were
to one customer. No single customer accounted for more than 10% of net sales for the year ended December 31,
2008.
Segment information
Net Sales Operating Earnings (Loss)
Years Ended December 31 2010 2009 2008 2010 2009 2008
Enterprise Mobility Solutions $ 7,857 $ 7,169 $ 8,228 $ 949 $ 736 $ (343)
Mobile Devices 7,819 7,146 12,099 (76) (1,215) (2,432)
Home 3,641 3,904 4,912 152 16 340
19,317 18,219 25,239 1,025 (463) (2,435)
Other and Eliminations (35) (72) (130) (236) (29) (107)
$19,282 $18,147 $25,109
Operating earnings (loss) 789 (492) (2,542)
Total other income (expense) (112) (11) (311)
Earnings (loss) from continuing operations before
income taxes $ 677 $ (503) $(2,853)
The Operating loss in Other and Eliminations consists of the following:
Years Ended December 31 2010 2009 2008
Separation-related transaction costs 242 42 59
Corporate expenses 16 843
Reorganization of business charges 730 38
Legal settlements, net (29) (75) 14
Environmental reserve charge —24 —
In-process research and development charges ——1
Gain on sale of property, plant and equipment —— (48)
$236 $ 29 $107
Corporate expenses are primarily comprised of general corporate-related expenses and the Company’s wholly-owned finance subsidiary.