Motorola 2010 Annual Report Download - page 116
Download and view the complete annual report
Please find page 116 of the 2010 Motorola annual report below. You can navigate through the pages in the report by either clicking on the pages listed below, or by using the keyword search tool below to find specific information within the annual report.-
 1
1 -
2
-
3
-
4
-
5
-
6
-
7
-
8
-
9
-
10
-
11
-
12
-
13
-
14
-
15
-
16
-
17
-
18
-
19
-
20
-
21
-
22
-
23
-
24
-
25
-
26
-
27
-
28
-
29
-
30
-
31
-
32
-
33
-
34
-
35
-
36
-
37
-
38
-
39
-
40
-
41
-
42
-
43
-
44
-
45
-
46
-
47
-
48
-
49
-
50
-
51
-
52
-
53
-
54
-
55
-
56
-
57
-
58
-
59
-
60
-
61
-
62
-
63
-
64
-
65
-
66
-
67
-
68
-
69
-
70
-
71
-
72
-
73
-
74
-
75
-
76
-
77
-
78
-
79
-
80
-
81
-
82
-
83
-
84
-
85
-
86
-
87
-
88
-
89
-
90
-
91
-
92
-
93
-
94
-
95
-
96
-
97
-
98
-
99
-
100
-
101
-
102
-
103
-
104
-
105
-
 106
106 -
 107
107 -
 108
108 -
 109
109 -
 110
110 -
 111
111 -
 112
112 -
 113
113 -
 114
114 -
 115
115 -
 116
116 -
 117
117 -
 118
118 -
 119
119 -
 120
120 -
 121
121 -
 122
122 -
 123
123 -
 124
124 -
 125
125 -
 126
126 -
127
-
128
-
129
-
130
-
131
-
132
-
133
-
134
-
135
-
136
-
137
-
138
-
139
-
140
-
141
-
142
-
143
-
144
 |
 |

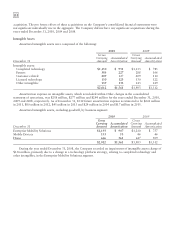
108
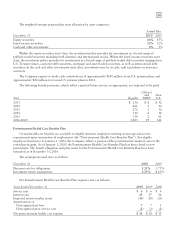
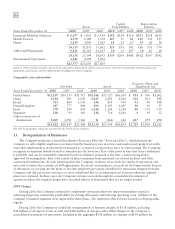
Non-U.S. Plans
December 31, 2010 Level 1 Level 2 Level 3 Total
Common stock and equivalents $339 $ — $— $ 339
Commingled equity funds — 389 — 389
Corporate bonds — 98 — 98
Government and agency obligations — 91 — 91
Commingled bond funds — 236 — 236
Short-term investment funds — 1 — 1
Insurance contracts — — 61 61
Total investment securities $339 $815 $61 $1,215
Cash 8
Accrued income receivable 3
Fair value plan assets $1,226
The following table summarizes the changes in fair value of the Non-U.S. pension plan assets measured using
Level 3 inputs:
2010
Balance at January 1 $65
Gain on assets held 1
Foreign exchange valuation adjustment (5)
Balance at December 31 $61
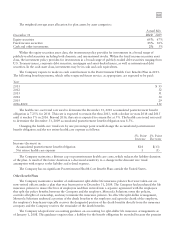
Postretirement Health Care Benefits Plan
December 31, 2010 Level 1 Level 2 Level 3 Total
Common stock and equivalents $48 $ — $— $ 48
Commingled equity funds — 62 — 62
U.S. government and agency obligations — 4 — 4
Corporate bonds — 7 — 7
Mortgage-backed bonds — 8 — 8
Asset-backed bonds — 2 — 2
Commingled bond funds — 34 — 34
Commingled short-term investment funds — 4 — 4
Invested cash — 1 — 1
Fair value plan assets $48 $122 — $170
The table above includes securities on loan as part of a securities lending arrangement of $4 million of common
stock and equivalents, $2 million of U.S. government and agency obligations and $1 million of corporate bonds. All
securities on loan are fully cash collateralized.
Valuation Methodologies
Level 1—Quoted market prices in active markets are available for investments in common and preferred stock
and common stock equivalents. As such, these investments are classified within Level 1.
Level 2—The securities classified as Level 2 are comprised primarily of corporate, government, agency and
government-sponsored enterprise bonds. The Company primarily relies on valuation pricing models, recent bid
prices, and broker quotes to determine the fair value of these securities. The valuation models for Level 2 assets are
developed and maintained by third party pricing services and use a number of standard inputs to the valuation
model including benchmark yields, reported trades, broker/dealer quotes where the party is standing ready and able
to transact, issuer spreads, benchmark securities, bids, offers and other reference data. The valuation model may
prioritize these inputs differently at each balance sheet date for any given security, based on the market conditions.