Motorola 2010 Annual Report Download - page 114
Download and view the complete annual report
Please find page 114 of the 2010 Motorola annual report below. You can navigate through the pages in the report by either clicking on the pages listed below, or by using the keyword search tool below to find specific information within the annual report.-
 1
1 -
2
-
3
-
4
-
5
-
6
-
7
-
8
-
9
-
10
-
11
-
12
-
13
-
14
-
15
-
16
-
17
-
18
-
19
-
20
-
21
-
22
-
23
-
24
-
25
-
26
-
27
-
28
-
29
-
30
-
31
-
32
-
33
-
34
-
35
-
36
-
37
-
38
-
39
-
40
-
41
-
42
-
43
-
44
-
45
-
46
-
47
-
48
-
49
-
50
-
51
-
52
-
53
-
54
-
55
-
56
-
57
-
58
-
59
-
60
-
61
-
62
-
63
-
64
-
65
-
66
-
67
-
68
-
69
-
70
-
71
-
72
-
73
-
74
-
75
-
76
-
77
-
78
-
79
-
80
-
81
-
82
-
83
-
84
-
85
-
86
-
87
-
88
-
89
-
90
-
91
-
92
-
93
-
94
-
95
-
96
-
97
-
98
-
99
-
100
-
101
-
102
-
103
-
 104
104 -
 105
105 -
 106
106 -
 107
107 -
 108
108 -
 109
109 -
 110
110 -
 111
111 -
 112
112 -
 113
113 -
 114
114 -
 115
115 -
 116
116 -
 117
117 -
 118
118 -
 119
119 -
 120
120 -
 121
121 -
 122
122 -
 123
123 -
 124
124 -
125
-
126
-
127
-
128
-
129
-
130
-
131
-
132
-
133
-
134
-
135
-
136
-
137
-
138
-
139
-
140
-
141
-
142
-
143
-
144
 |
 |

106
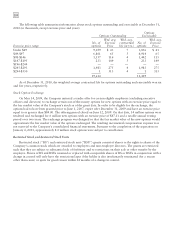
9. Fair Value Measurements
The Company holds certain fixed income securities, equity securities and derivatives, which must be measured
using the fair value hierarchy and related valuation methodologies. The guidance specifies a hierarchy of valuation
techniques based on whether the inputs to each measurement are observable or unobservable. Observable inputs
reflect market data obtained from independent sources, while unobservable inputs reflect the Company’s
assumptions about current market conditions. The prescribed fair value hierarchy and related valuation
methodologies are as follows:
Level 1—Quoted prices for identical instruments in active markets.
Level 2—Quoted prices for similar instruments in active markets, quoted prices for identical or similar
instruments in markets that are not active and model-derived valuations, in which all significant inputs are
observable in active markets.
Level 3—Valuations derived from valuation techniques, in which one or more significant inputs are
unobservable.
The fair values of the Company’s financial assets and liabilities by level in the fair value hierarchy as of
December 31, 2010 and 2009 were as follows:
December 31, 2010 Level 1 Level 2 Level 3 Total
Assets:
Sigma Fund securities:
U.S. government, agency and government-sponsored enterprise
obligations $— $2,291 $ — $2,291
Corporate bonds — 43 15 58
Asset-backed securities — 1 — 1
Mortgage-backed securities — 11 — 11
Available-for-sale securities:
U.S. government, agency and government-sponsored enterprise
obligations — 17 — 17
Corporate bonds — 11 — 11
Mortgage-backed securities — 3 — 3
Common stock and equivalents 24 10 — 34
Foreign exchange derivative contracts* — 5 — 5
Liabilities:
Foreign exchange derivative contracts* — 15 — 15
Interest agreement derivative contracts — 3 — 3
* Includes immaterial amounts related to held for sale businesses.
December 31, 2009 Level 1 Level 2 Level 3 Total
Assets:
Sigma Fund securities:
U.S. government, agency and government-sponsored enterprise
obligations $ — $4,408 $— $4,408
Corporate bonds — 411 19 430
Asset-backed securities — 66 — 66
Mortgage-backed securities — 52 — 52
Available-for-sale securities:
U.S. government, agency and government-sponsored enterprise
obligations — 23 — 23
Corporate bonds — 10 — 10
Mortgage-backed securities — 3 — 3
Common stock and equivalents 136 11 — 147
Foreign exchange derivative contracts* — 15 — 15
Liabilities:
Foreign exchange derivative contracts* — 17 — 17
Interest agreement derivative contracts — 4 — 4
* Includes immaterial amounts related to held for sale businesses.