Motorola 2010 Annual Report Download - page 111
Download and view the complete annual report
Please find page 111 of the 2010 Motorola annual report below. You can navigate through the pages in the report by either clicking on the pages listed below, or by using the keyword search tool below to find specific information within the annual report.-
 1
1 -
2
-
3
-
4
-
5
-
6
-
7
-
8
-
9
-
10
-
11
-
12
-
13
-
14
-
15
-
16
-
17
-
18
-
19
-
20
-
21
-
22
-
23
-
24
-
25
-
26
-
27
-
28
-
29
-
30
-
31
-
32
-
33
-
34
-
35
-
36
-
37
-
38
-
39
-
40
-
41
-
42
-
43
-
44
-
45
-
46
-
47
-
48
-
49
-
50
-
51
-
52
-
53
-
54
-
55
-
56
-
57
-
58
-
59
-
60
-
61
-
62
-
63
-
64
-
65
-
66
-
67
-
68
-
69
-
70
-
71
-
72
-
73
-
74
-
75
-
76
-
77
-
78
-
79
-
80
-
81
-
82
-
83
-
84
-
85
-
86
-
87
-
88
-
89
-
90
-
91
-
92
-
93
-
94
-
95
-
96
-
97
-
98
-
99
-
100
-
 101
101 -
 102
102 -
 103
103 -
 104
104 -
 105
105 -
 106
106 -
 107
107 -
 108
108 -
 109
109 -
 110
110 -
 111
111 -
 112
112 -
 113
113 -
 114
114 -
 115
115 -
 116
116 -
 117
117 -
 118
118 -
 119
119 -
 120
120 -
 121
121 -
122
-
123
-
124
-
125
-
126
-
127
-
128
-
129
-
130
-
131
-
132
-
133
-
134
-
135
-
136
-
137
-
138
-
139
-
140
-
141
-
142
-
143
-
144
 |
 |

103
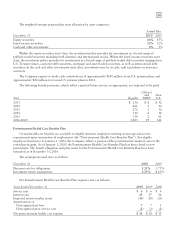
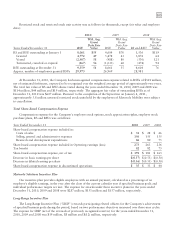
The Company calculates the value of each employee stock option, estimated on the date of grant, using the
Black-Scholes option pricing model. The weighted-average estimated fair value of employee stock options granted
during 2010, 2009 and 2008 was $21.43, $19.43 and $24.30, respectively, using the following weighted-average
assumptions:
2010 2009 2008
Expected volatility 41.7% 57.1% 56.4%
Risk-free interest rate 2.1% 1.9% 2.4%
Dividend yield 0.0% 0.0% 2.7%
Expected life (years) 6.1 3.9 5.5
The Company uses the implied volatility for traded options on the Company’s stock as the expected volatility
assumption required in the Black-Scholes model. The selection of the implied volatility approach was based upon
the availability of actively traded options on the Company’s stock and the Company’s assessment that implied
volatility is more representative of future stock price trends than historical volatility.
The risk-free interest rate assumption is based upon the average daily closing rates during the year for U.S.
treasury notes that have a life which approximates the expected life of the option. The dividend yield assumption is
based on the Company’s future expectation of dividend payouts. The expected life of employee stock options
represents the average of the contractual term of the options and the weighted-average vesting period for all option
tranches.
The Company has applied forfeiture rates, estimated based on historical data, of 13%-50% to the option fair
values calculated by the Black-Scholes option pricing model. These estimated forfeiture rates are applied to grants
based on their remaining vesting term and may be revised in subsequent periods if actual forfeitures differ from
these estimates.
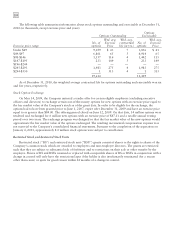
Stock option activity was as follows (in thousands, except exercise price and employee data):
2010 2009 2008
Years Ended December 31
Shares
Subject to
Options
Wtd. Avg.
Exercise
Price
Shares
Subject to
Options
Wtd. Avg.
Exercise
Price
Shares
Subject to
Options
Wtd. Avg.
Exercise
Price
Options outstanding at January 1 23,061 $ 84 32,592 $120 32,036 $131
Options granted 1,630 50 8,939 45 5,681 58
Options exercised (1,559) 42 (206) 42 (274) 50
Options terminated, canceled or expired (3,518) 104 (18,264) 128 (4,851) 123
Options outstanding at December 31 19,614 81 23,061 84 32,592 120
Options exercisable at December 31 12,429 99 11,037 121 21,153 134
Approx. number of employees granted
options 529 22,095 3,300
At December 31, 2010, the Company had $100 million of total unrecognized compensation expense, net of
estimated forfeitures, related to stock option plans and the employee stock purchase plan that will be recognized
over the weighted average period of approximately two years. Cash received from stock option exercises and the
employee stock purchase plan was $179 million, $116 million and $145 million for the years ended December 31,
2010, 2009 and 2008, respectively. The total intrinsic value of options exercised during the years ended
December 31, 2010, 2009 and 2008 was $17 million, $1 million and $2 million, respectively. The aggregate
intrinsic value for options outstanding and exercisable as of December 31, 2010 was $213 million and $111 million,
respectively, based on a December 31, 2010 stock price of $63.49 per share. Pursuant to the completion of the
Separation on January 4, 2011, approximately 8.0 million stock options held by the employees of Motorola
Mobility were subject to cancellation.
At December 31, 2010 and 2009, 6.6 million shares and 8.6 million shares, respectively, were available for
future share-based award grants under the current share-based compensation plan, covering all equity awards to
employees and non-employee directors.