Motorola 2010 Annual Report Download - page 122
Download and view the complete annual report
Please find page 122 of the 2010 Motorola annual report below. You can navigate through the pages in the report by either clicking on the pages listed below, or by using the keyword search tool below to find specific information within the annual report.-
 1
1 -
2
-
3
-
4
-
5
-
6
-
7
-
8
-
9
-
10
-
11
-
12
-
13
-
14
-
15
-
16
-
17
-
18
-
19
-
20
-
21
-
22
-
23
-
24
-
25
-
26
-
27
-
28
-
29
-
30
-
31
-
32
-
33
-
34
-
35
-
36
-
37
-
38
-
39
-
40
-
41
-
42
-
43
-
44
-
45
-
46
-
47
-
48
-
49
-
50
-
51
-
52
-
53
-
54
-
55
-
56
-
57
-
58
-
59
-
60
-
61
-
62
-
63
-
64
-
65
-
66
-
67
-
68
-
69
-
70
-
71
-
72
-
73
-
74
-
75
-
76
-
77
-
78
-
79
-
80
-
81
-
82
-
83
-
84
-
85
-
86
-
87
-
88
-
89
-
90
-
91
-
92
-
93
-
94
-
95
-
96
-
97
-
98
-
99
-
100
-
101
-
102
-
103
-
104
-
105
-
106
-
107
-
108
-
109
-
110
-
111
-
 112
112 -
 113
113 -
 114
114 -
 115
115 -
 116
116 -
 117
117 -
 118
118 -
 119
119 -
 120
120 -
 121
121 -
 122
122 -
 123
123 -
 124
124 -
 125
125 -
 126
126 -
 127
127 -
 128
128 -
 129
129 -
 130
130 -
 131
131 -
 132
132 -
133
-
134
-
135
-
136
-
137
-
138
-
139
-
140
-
141
-
142
-
143
-
144
 |
 |

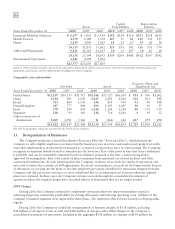
114
Assets
Capital
Expenditures
Depreciation
Expense
Years Ended December 31 2010 2009 2008 2010 2009 2008 2010 2009 2008
Enterprise Mobility Solutions $ 6,297 $ 5,801 $ 6,114 $182 $124 $150 $143 $158 $159
Mobile Devices 4,179 2,589 3,559 125 35 84 119 131 157
Home 3,839 3,441 3,929 18 32 67 54 62 58
14,315 11,831 13,602 325 191 301 316 351 374
Other and Eliminations 9,841 11,563 11,253 10 13 107 (4) 16 18
24,156 23,394 24,855 $335 $204 $408 $312 $367 $392
Discontinued Operations 1,421 2,209 3,014
$25,577 $25,603 $27,869
Assets in Other include primarily cash and cash equivalents, Sigma Fund, deferred income taxes, short-term investments, property, plant and
equipment, investments, and the administrative headquarters of the Company.
Geographic area information
Net Sales Assets
Property, Plant, and
Equipment, net
Years Ended December 31 2010 2009 2008 2010 2009 2008 2010 2009 2008
United States $11,107 $10,513 $13,715 $18,386 $17,327 $16,619 $ 915 $ 856 $1,002
China 1,128 905 1,250 2,465 2,295 2,803 212 161 198
Brazil 913 849 1,550 836 855 993 91 98 108
United Kingdom 687 577 909 896 1,143 1,047 30 34 35
Israel 270 299 443 1,344 1,324 1,269 40 172 139
Singapore 108 93 116 218 716 1,862 419 32
Other nations, net of
eliminations 5,069 4,911 7,126 11 (266) 262 437 479 498
$19,282 $18,147 $25,109 $24,156 $23,394 $24,855 $1,729 $1,819 $2,012
Net sales by geographic region are measured by the locale of end customer.
13. Reorganization of Businesses
The Company maintains a formal Involuntary Severance Plan (the “Severance Plan”), which permits the
Company to offer eligible employees severance benefits based on years of service and employment grade level in the
event that employment is involuntarily terminated as a result of a reduction-in-force or restructuring. The Company
recognizes termination benefits based on formulas per the Severance Plan at the point in time that future settlement
is probable and can be reasonably estimated based on estimates prepared at the time a restructuring plan is
approved by management. Exit costs consist of future minimum lease payments on vacated facilities and other
contractual terminations. At each reporting date, the Company evaluates its accruals for employee separation and
exit costs to ensure the accruals are still appropriate. In certain circumstances, accruals are no longer needed because
of efficiencies in carrying out the plans or because employees previously identified for separation resigned from the
Company and did not receive severance or were redeployed due to circumstances not foreseen when the original
plans were initiated. In these cases, the Company reverses accruals through the consolidated statements of
operations where the original charges were recorded when it is determined they are no longer needed.
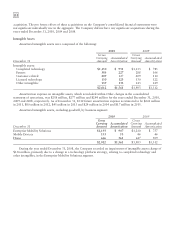
2010 Charges
During 2010, the Company continued to implement various productivity improvement plans aimed at
achieving long-term, sustainable profitability by driving efficiencies and reducing operating costs. All three of the
Company’s business segments were impacted by these plans. The employees affected were located in all geographic
regions.
During 2010, the Company recorded net reorganization of business charges of $138 million, including
$38 million of charges in Costs of sales and $100 million of charges under Other charges in the Company’s
consolidated statements of operations. Included in the aggregate $138 million are charges of $150 million for