Motorola 2010 Annual Report Download - page 48
Download and view the complete annual report
Please find page 48 of the 2010 Motorola annual report below. You can navigate through the pages in the report by either clicking on the pages listed below, or by using the keyword search tool below to find specific information within the annual report.-
 1
1 -
2
-
3
-
4
-
5
-
6
-
7
-
8
-
9
-
10
-
11
-
12
-
13
-
14
-
15
-
16
-
17
-
18
-
19
-
20
-
21
-
22
-
23
-
24
-
25
-
26
-
27
-
28
-
29
-
30
-
31
-
32
-
33
-
34
-
35
-
36
-
37
-
 38
38 -
 39
39 -
 40
40 -
 41
41 -
 42
42 -
 43
43 -
 44
44 -
 45
45 -
 46
46 -
 47
47 -
 48
48 -
 49
49 -
 50
50 -
 51
51 -
 52
52 -
 53
53 -
 54
54 -
 55
55 -
 56
56 -
 57
57 -
 58
58 -
59
-
60
-
61
-
62
-
63
-
64
-
65
-
66
-
67
-
68
-
69
-
70
-
71
-
72
-
73
-
74
-
75
-
76
-
77
-
78
-
79
-
80
-
81
-
82
-
83
-
84
-
85
-
86
-
87
-
88
-
89
-
90
-
91
-
92
-
93
-
94
-
95
-
96
-
97
-
98
-
99
-
100
-
101
-
102
-
103
-
104
-
105
-
106
-
107
-
108
-
109
-
110
-
111
-
112
-
113
-
114
-
115
-
116
-
117
-
118
-
119
-
120
-
121
-
122
-
123
-
124
-
125
-
126
-
127
-
128
-
129
-
130
-
131
-
132
-
133
-
134
-
135
-
136
-
137
-
138
-
139
-
140
-
141
-
142
-
143
-
144
 |
 |

40
approvals. During the second quarter of 2010, the Company completed the sale of our Israel-based wireless network
operator. During the first quarter of 2009, the Company completed the sales of: (i) Good Technology, and (ii) the
Company’s former biometrics business unit, which included its Printrak trademark.
After taxes, the Company had earnings from discontinued operations of $379 million, or $1.12 per diluted
share, in 2010, compared to earnings from discontinued operations of $316 million, or $0.96 per diluted share, in
2009.
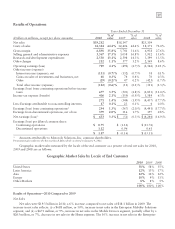
Results of Operations—2009 Compared to 2008
Net Sales
Net sales were $18.1 billion in 2009, down 28% compared to net sales of $25.1 billion in 2008. The decrease
in net sales reflects: (i) a $5.0 billion, or 41%, decrease in net sales in the Mobile Devices segment, (ii) a $1.0 billion,
or 21%, decrease in net sales in the Home segment, and (iii) a $1.1 billion, or 13%, decrease in net sales in the
Enterprise Mobility Solutions segment. The 41% decrease in net sales in the Mobile Devices segment was primarily
driven by a 45% decrease in unit shipments, partially offset by an 8% increase in ASP. The 21% decrease in net
sales in the Home segment was primarily driven by a 24% decrease in net revenues of set-top boxes, reflecting:
(i) an 18% decrease in unit shipments of set-top boxes, and (ii) a lower ASP due to an unfavorable shift in product
mix. The 13% decrease in net sales in the Enterprise Mobility Solutions segment reflects a 21% decrease in net sales
to the commercial enterprise market and a 10% decrease in net sales to the government and public safety market.
Gross Margin
Gross margin was $5.7 billion, or 31.6% of net sales, in 2009, compared to $6.9 billion, or 27.6% of net sales,
in 2008. Gross margin decreased in all segments. The decrease in gross margin in the Mobile Devices segment was
primarily driven by the 41% decrease in net sales, partially offset by: (i) supply chain efficiencies, primarily
including lower excess inventory charges in 2009 than in 2008, when the charges included a $370 million charge
due to a decision to consolidate software and silicon platforms, and (ii) the absence in 2009 of a comparable
$150 million charge in 2008 related to settlement of a purchase commitment. The decrease in gross margin in the
Enterprise Mobility Solutions segment was primarily driven by the 13% decrease in net sales and an unfavorable
product mix. The decrease in gross margin in the Home segment was primarily driven by the 21% decrease in net
sales, partially offset by a favorable product mix.
The increase in gross margin as a percentage of net sales in 2009 compared to 2008 was primarily driven by
increases in gross margin percentage in the Mobile Devices segment, partially offset by a decrease in gross margin
percentage in the Enterprise Mobility Solutions and Home segments. The Company’s overall gross margin as a
percentage of net sales can be impacted by the proportion of overall net sales generated by its various businesses. In
2009, the proportion of overall sales by our Mobile Devices business was smaller than in previous years. Since
Mobile Devices has the lowest gross margin percentage of the Company’s businesses, this positively impacted
overall gross margin percentage in 2009.
Selling, General and Administrative Expenses
SG&A expenses decreased 22% to $3.1 billion, or 16.8% of net sales, in 2009, compared to $3.9 billion, or
15.6% of net sales, in 2008. SG&A expenses decreased in the Mobile Devices and Enterprise Mobility Solutions
segments and increased slightly in the Home segment. The decrease in SG&A expenses in the Mobile Devices
segment was primarily driven by lower marketing expenses and savings from cost-reduction initiatives. The decrease
in SG&A expenses in the Enterprise Mobility Solutions segment was primarily due to savings from cost-reduction
initiatives. The slight increase in SG&A expenses in the Home segment was primarily due to increased
administrative expenses, partially offset by savings from cost-reduction initiatives. SG&A expenses as a percentage
of net sales increased in all segments.
Research and Development Expenditures
Research and development (“R&D”) expenditures decreased 24% to $2.6 billion, or 14.3% of net sales, in
2009, compared to $3.4 billion, or 13.5% of net sales, in 2008. R&D expenditures decreased in all segments,
primarily due to savings from cost-reduction initiatives. R&D expenditures as a percentage of net sales increased in
all segments. The Company participates in very competitive industries with constant changes in technology and,
accordingly, the Company continues to believe that a strong commitment to R&D is required to drive long-term
growth.