Motorola 2010 Annual Report Download - page 113
Download and view the complete annual report
Please find page 113 of the 2010 Motorola annual report below. You can navigate through the pages in the report by either clicking on the pages listed below, or by using the keyword search tool below to find specific information within the annual report.-
 1
1 -
2
-
3
-
4
-
5
-
6
-
7
-
8
-
9
-
10
-
11
-
12
-
13
-
14
-
15
-
16
-
17
-
18
-
19
-
20
-
21
-
22
-
23
-
24
-
25
-
26
-
27
-
28
-
29
-
30
-
31
-
32
-
33
-
34
-
35
-
36
-
37
-
38
-
39
-
40
-
41
-
42
-
43
-
44
-
45
-
46
-
47
-
48
-
49
-
50
-
51
-
52
-
53
-
54
-
55
-
56
-
57
-
58
-
59
-
60
-
61
-
62
-
63
-
64
-
65
-
66
-
67
-
68
-
69
-
70
-
71
-
72
-
73
-
74
-
75
-
76
-
77
-
78
-
79
-
80
-
81
-
82
-
83
-
84
-
85
-
86
-
87
-
88
-
89
-
90
-
91
-
92
-
93
-
94
-
95
-
96
-
97
-
98
-
99
-
100
-
101
-
102
-
 103
103 -
 104
104 -
 105
105 -
 106
106 -
 107
107 -
 108
108 -
 109
109 -
 110
110 -
 111
111 -
 112
112 -
 113
113 -
 114
114 -
 115
115 -
 116
116 -
 117
117 -
 118
118 -
 119
119 -
 120
120 -
 121
121 -
 122
122 -
 123
123 -
124
-
125
-
126
-
127
-
128
-
129
-
130
-
131
-
132
-
133
-
134
-
135
-
136
-
137
-
138
-
139
-
140
-
141
-
142
-
143
-
144
 |
 |

105
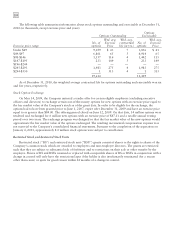
Restricted stock and restricted stock unit activity was as follows (in thousands, except fair value and employee
data):
2010 2009 2008
Years Ended December 31 RSU
Wtd. Avg.
Grant
Date Fair
Value RSU
Wtd Avg.
Grant
Date Fair
Value RS and RSU
Wtd Avg.
Grant
Date Fair
Value
RS and RSU outstanding at January 1 8,061 $55 4,604 $76 1,536 $119
Granted 4,772 49 5,478 43 3,872 64
Vested (2,407) 58 (988) 80 (330) 121
Terminated, canceled or expired (867) 56 (1,033) 60 (474) 94
RSU outstanding at December 31 9,559 51 8,061 55 4,604 76
Approx. number of employees granted RSUs 29,973 26,969 28,981
At December 31, 2010, the Company had unrecognized compensation expense related to RSUs of $301 million,
net of estimated forfeitures, expected to be recognized over the weighted average period of approximately two years.
The total fair value of RS and RSU shares vested during the years ended December 31, 2010, 2009 and 2008 was
$114 million, $44 million and $19 million, respectively. The aggregate fair value of outstanding RSUs as of
December 31, 2010 was $607 million. Pursuant to the completion of the Separation on January 4, 2011,
approximately 3.8 million unvested restricted stock units held by the employees of Motorola Mobility were subject
to cancellation.
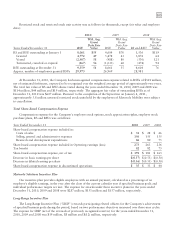
Total Share-Based Compensation Expense
Compensation expense for the Company’s employee stock options, stock appreciation rights, employee stock
purchase plans, RS and RSUs was as follows:
Year Ended December 31 2010 2009 2008
Share-based compensation expense included in:
Costs of sales $31$28$26
Selling, general and administrative expenses 156 155 135
Research and development expenditures 86 80 75
Share-based compensation expense included in Operating earnings (loss) 273 263 236
Tax benefit 82 82 73
Share-based compensation expense, net of tax $ 191 $ 181 $ 163
Decrease in basic earnings per share $(0.57) $(0.55) $(0.50)
Decrease in diluted earning per share $(0.56) $(0.55) $(0.50)
Share-based compensation expense in discontinued operations $35$33$44
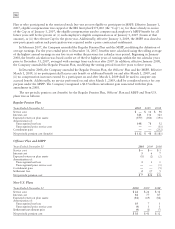
Motorola Solutions Incentive Plan
Our incentive plan provides eligible employees with an annual payment, calculated as a percentage of an
employee’s eligible earnings, in the year after the close of the current calendar year if specified business goals and
individual performance targets are met. The expense for awards under these incentive plans for the years ended
December 31, 2010, 2009 and 2008 were $287 million, $153 million and $137 million, respectively.
Long-Range Incentive Plan
The Long-Range Incentive Plan (“LRIP”) rewards participating elected officers for the Company’s achievement
of specified business goals during the period, based on two performance objectives measured over three-year cycles.
The expense for LRIP (net of the reversals of previously recognized reserves) for the years ended December 31,
2010, 2009 and 2008 was $19 million, $8 million and $(12) million, respectively.